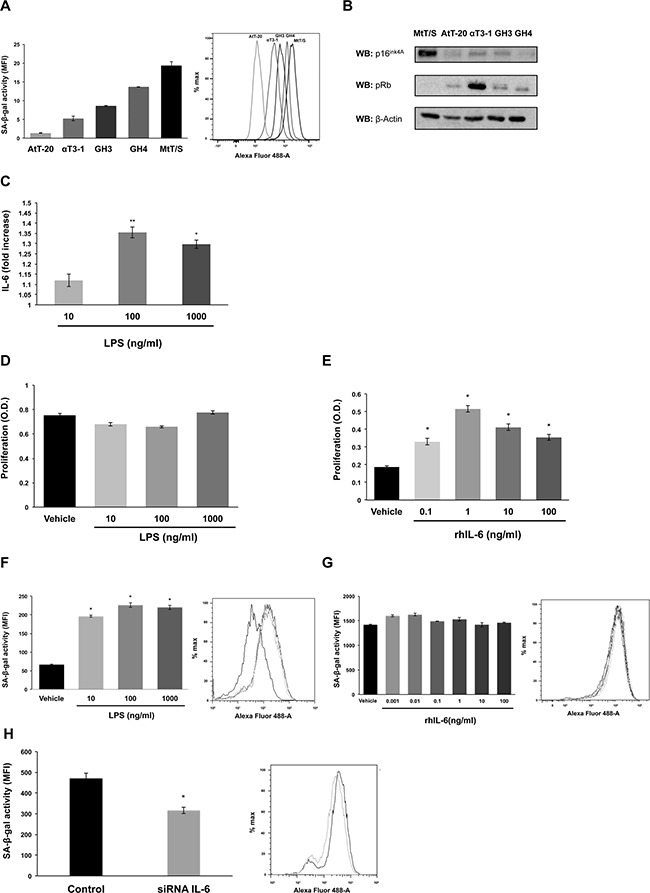
Figure 1. MtT/S pituitary cell line presents a senescent phenotype modulated by endogenous IL-6.

A. SA-β-gal activity was measured by flow cytometry. The bar graph represents the SA-β-gal activity measured by the mean fluorescence intensity (MFI). B. To assay pRb and p16INK4a protein levels, cell extracts were subjected to western blot (WB) with the indicated antibodies. β-Actin was used as loading control. C. IL-6 secretion by MtT/S cells under basal and stimulated conditions with LPS was measured by ELISA. Values represent the average fold stimulation with respect to basal. Absolute values of basal (similar to vehicle) IL-6: 72.71±0.74 pg/ml (30,000 cells/well). D-E. Effect of LPS and rhIL-6 on MtT/S cell proliferation, measured with the WST-1 assay (A450nm). F-H. Effect of LPS, rhIL-6 and siRNA IL-6 on MtT/S SA-β-gal activity. The grey scale used in the histogram plot correspond to the grey scale used in the bar graph, which represent the SA-β-gal activity measured by the mean fluorescence intensity (MFI). One representative experiment from three independent experiments (N= 4 for each condition in each experiment) with similar results is shown. Results are expressed as mean ± SEM. *p<0.05 and **p<0.01 compared with cells treated with vehicle (C-G) or cells transfected with siRNA GL3 as control (H). ANOVA with Scheffé's test.
