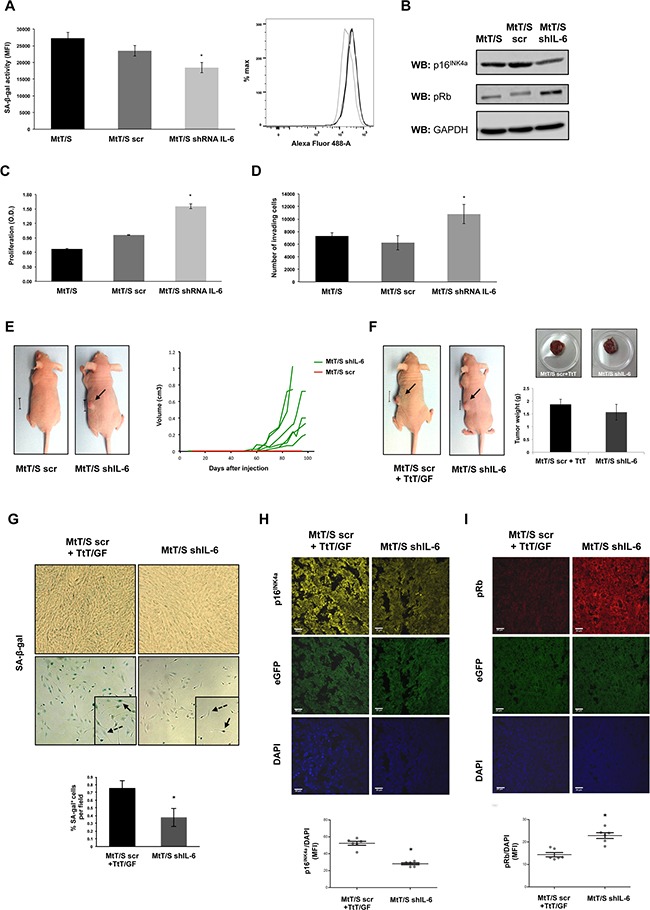
Figure 2. IL-6 silenced clones present decreased senescent biomarkers and acquire the capacity to form tumors.

A. SA-β-gal activity was measured on MtT/S wild type (MtT/S), MtT/S control (MtT/S scr) and MtT/S IL-6 silenced (MtT/S shIL-6) clones, by flow cytometry. The bar graph represents the SA-β-gal activity measured by the mean fluorescence intensity (MFI). B. For pRb and p16INK4a protein levels, cell extracts were subjected to western blot (WB) with the indicated antibodies. GAPDH was used as loading control. C-D. Cell proliferation, measured by WST-1 assay (A450nm), and cell invasion, measured using transwells, were performed on MtT/S, MtT/S scr and MtT/S shIL-6 clones. One representative experiment from three independent experiments (N= 3 for each condition in each experiment) with similar results is shown (A-D). Results are expressed as mean ± SEM. *p<0.05 compared with MtT/S and MtT/S scr, ANOVA with Scheffé's test (A, C and D). E. MtT/S scr and MtT/S shIL-6 clones were injected subcutaneously (5×10⁵ cells for each clone). Photographs were taken at 70 days. One mouse with similar results to all the others of each group is shown (i.e. no tumor in all the animals injected with MtT/S scr cells and tumors similar to the one shown in the picture in all animals injected with MtT/S shIL-6). Volume of each of the tumors of one of three independent experiments with six mice in each group in each experiment with similar results is shown. The six MtT/S scr mice did not form tumors and overlap in one red line and the volume from each of the tumors from the MtT/S shIL-6 group is shown in green. F. MtT/S scr with TtT/GF and MtT/S shIL-6 cells were injected subcutaneously in 2 groups of five male nude mice (5×10⁵ cells for each clone and 1,8×10⁵ cell for TtT/GF). Photographs of mice were taken at 70 days. Tumor weights were obtained at the end of the experiment. One mouse and one tumor with similar results to the others of each group are shown. Three independent experiments with five mice in each group in each experiment were performed, showing similar results. Weights of one of these experiments are shown in the graph. G. 6μm tumor cryosections (upper panel, x20 magnification) and primary cell cultures derived from the same tumor (lower panel, x10 magnification) were stained for SA-β-gal. Arrows and dotted line arrows indicate examples of SA-β-gal positive and negative cells, respectively. Quantification of positive SA-β-gal cells is shown. Results obtained from 20 independent pictures for each condition are expressed as mean ± SEM. H-I. 6μm tumor sections were stained by double immunofluorescence with p16INK4a (yellow; 1:50), pRb (red; 1:50) and 4′,6-diamidino-2-phenylindole (DAPI) for staining cell nuclei (blue). Tumors developed by the injected cells were verified by the detection of eGFP (green). Images were acquired at x63 magnification (scale bar: 20μm). p16INK4a and pRb were quantified by the mean fluorescence intensity (MFI) and relativized to DAPI signal. Results obtained from six independent pictures for each condition are expressed as mean ± SEM. One representative picture for each condition is shown. *p<0.05 compared with tumors developed by the co-injection of MtT/S scr and TtT/GF, Student t test (H-I).
