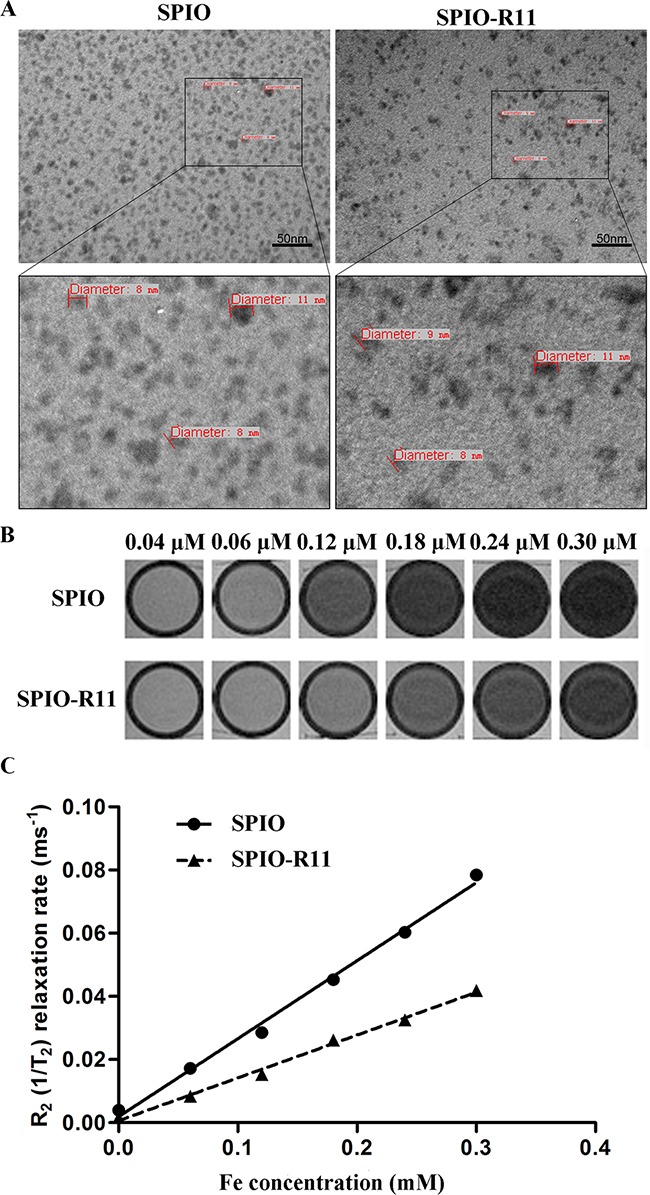
Figure 1. A. TEM image of SPIO and SPIO-R11.

Top row represents nanoparticles at a magnification of 200,000×. The black box outlines the area magnified and presented in the bottom row showing both the nanoparticles without obvious aggregation. The small dark spheres were the iron oxide cores of the nanoparticles and the size of cores is around 8-11 nm. Scale bar, 50 nm. B. T2-weighted MR images (GE 3.0T, multiple spin echo sequence: TR=4000 ms, TE=60 ms) of the above nanoparticles at different concentrations. C. R2 relaxation rates (1/T2, s−1) of SPIO and SPIO-R11 as a function of Fe concentration in water at a magnetic field of 3T at room temperature. The r2 values of SPIO and SPIO-R11 were 232 mM−1s−1 and 135 mM−1s−1, respectively.
