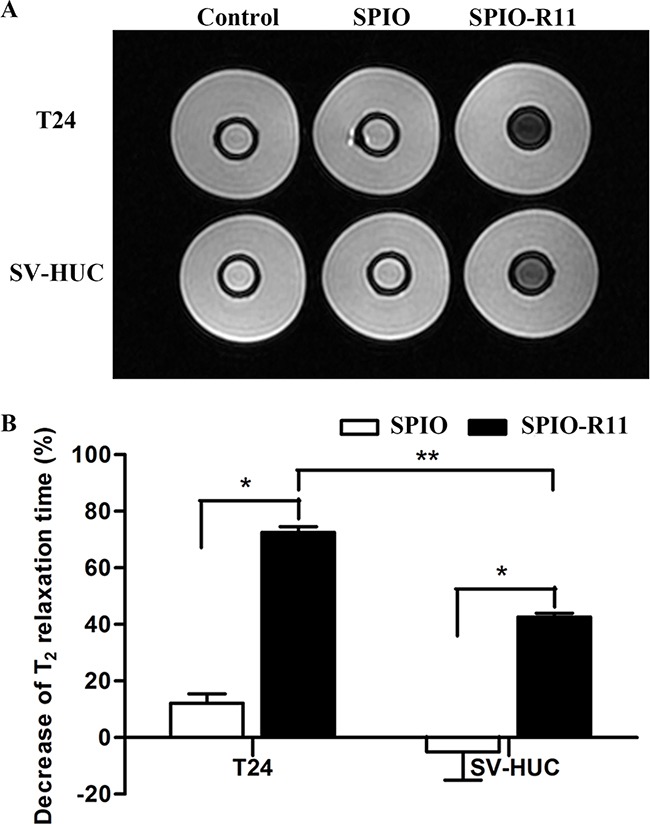
Figure 5. A. T2-weighted MR image of cells in gelatin (5×10⁶ cells/mL) before and after 4 h incubation with SPIO and SPIO-R11 (50 μg/mL of Fe concentration).

Compared with the sample containing cells that were incubated with SPIO, the SI is clearly lower when cells were incubated with SPIO-R11. This decrease of SI was more obvious in T24 cells compared to SV-HUC cells. B. Significant decrease in MR T2 relaxation times with SPIO-R11 compared to SPIO. Moreover, after incubation with SPIO-R11, T24 cells showed a more pronounced decrease in MR T2 relaxation time than SV-HUC cells. Columns, mean; bars, SD. *, P < 0.05; **, P < 0.001.
