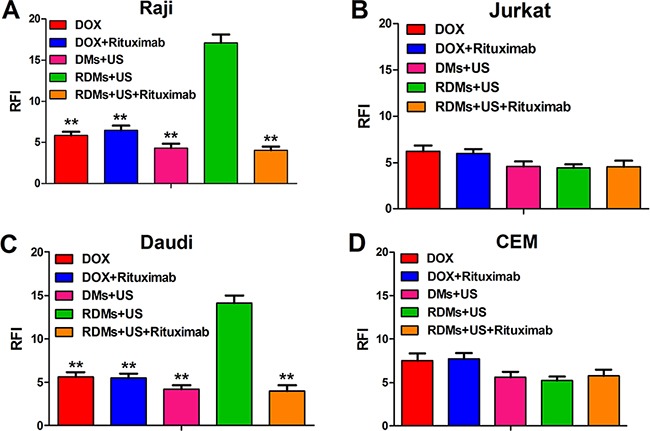
Figure 7. DOX relative fluorescence intensity (RFI) in Raji, Daudi, Jurkat and CEM cells.

Cell RFIs were analyzed 48 h after treatment with DOX, DOX + rituximab, DMs + US, RDMs + US, and RDMs + US + rituximab by flow cytometry. Data are represented as means ± SD (n=3). **P<0.01 compared with RDM + US.
