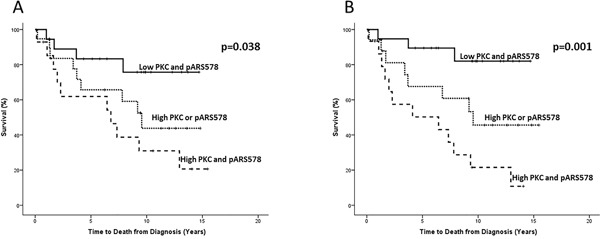
Figure 4. Kaplan-Meier survival plots illustrating disease-specific survival in hormone-naïve prostate cancer patients with nuclear PKC expression combined with nuclear A. and cytoplasmic B. pARS578 expression.

Protein expression was divided for analysis as low (≤median) and high (>median) and nuclear PKC expression was combined with pARS578 expression to give the following scores; low nuclear PKC and pARS578 (solid line), high nuclear PKC or pARS578 (dotted line) and high nuclear PKC and pARS578 (dashed line).
