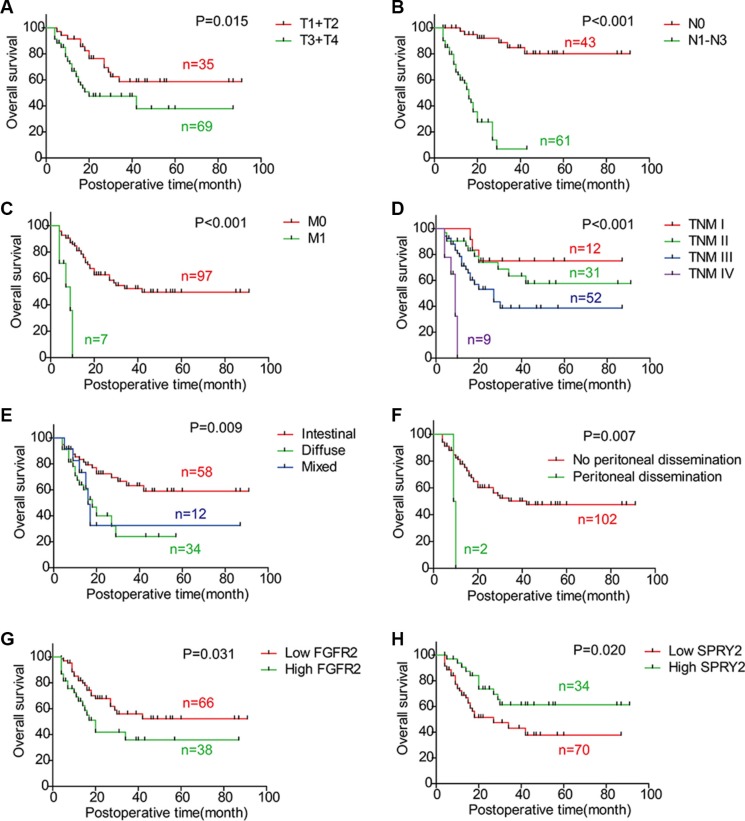
Figure 2. Correlations between overall survival rate and clinicopathologic factors.
The survival curves were graphed with Kaplan-Meier method and the statistical difference was analyzed with log-rank test. This figure displays the overall survival curves of (A) T1/T2 and T3/T4; (B) N0 and N1-3; (C) M0 and M1; (D) TNM stage; (E) Intestinal type, diffuse type and mixed type; (F) Negative and positive peritoneal dissemination; (G) FGFR2 low-expression and high-expression; (H) SPRY2 low-expression and high-expression.

