
Figure 5. Hazard ratios and 95% CIs in different subgroups of LR and RR (Forest plot analysis).
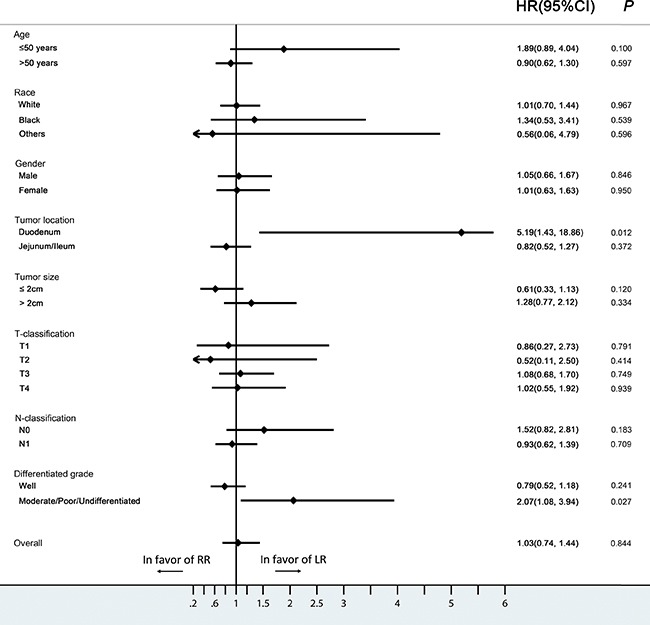
CI, confidence interval; HR, hazard ratio; LR, local resection; RR, radical resection.
Official websites use .gov
A
.gov website belongs to an official
government organization in the United States.
Secure .gov websites use HTTPS
A lock (
) or https:// means you've safely
connected to the .gov website. Share sensitive
information only on official, secure websites.
CI, confidence interval; HR, hazard ratio; LR, local resection; RR, radical resection.