
Figure 3. The forest plots show the pooled diagnosis index and Summary receiver operating characteristic curves (SROC) of miR-106a for the diagnosis of CRC.
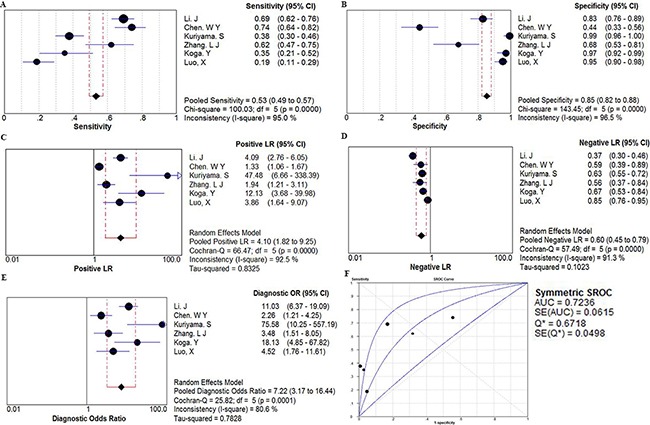
The point efficiencies from each study are shown as squares and the pooled efficiencies are shown as diamond. Degree of freedom is abbreviated as df. Inconsistency is used to quantify the heterogeneity caused by non-threshold effect. Of these studies, random effects model was used to pool these data. A. sensitivity; B. specificity; C. positive likelihood ratio(PLR); D. negative likelihood ratio(NLR); E. diagnostic OR(DOR), and their 95% CI are displayed respectively, which suggests miR106aa might be a potential noninvasive diagnosis biomarker of CRC. F. Every square stands for a study. The SROC curve is symmetric and the AUC is 0.7236, which intimates a moderate diagnostic accuracy for diagnosing CRC.