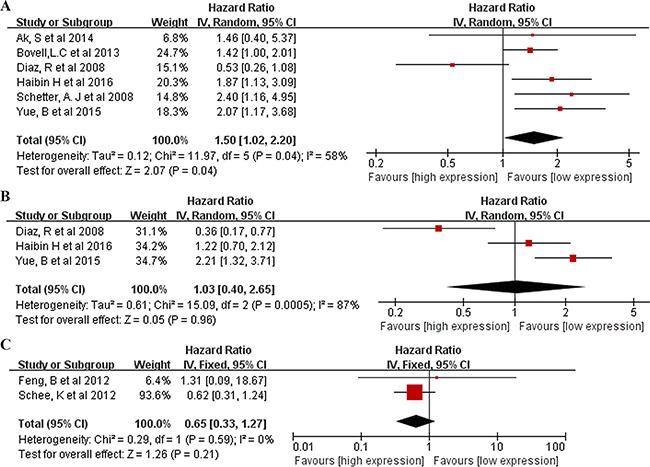
Figure 4. Forrest plots of studies evaluating hazard ratios of high miR106a level.

A. Overall survival test. The survival data from 6 articles were pooled to calculate overall survival. The random effects analysis model showed the pooled HR for overall survival is 1.50 with 95% CI:1.02–2.20, and P <0.05. B. Survival data were presented as disease-free survival, the random effect analysis model was used to calculate the pooled HR, and HR = 1.03 (95%CI: 0.40–2.65, P >0.05) for DFS. C. Survival data were presented as metastasis-free survival, the fixed effect analysis model was used to calculate the pooled HR, and HR = 0.65 (95%CI: 0.33–1.27, P >0.05) for MFS.
