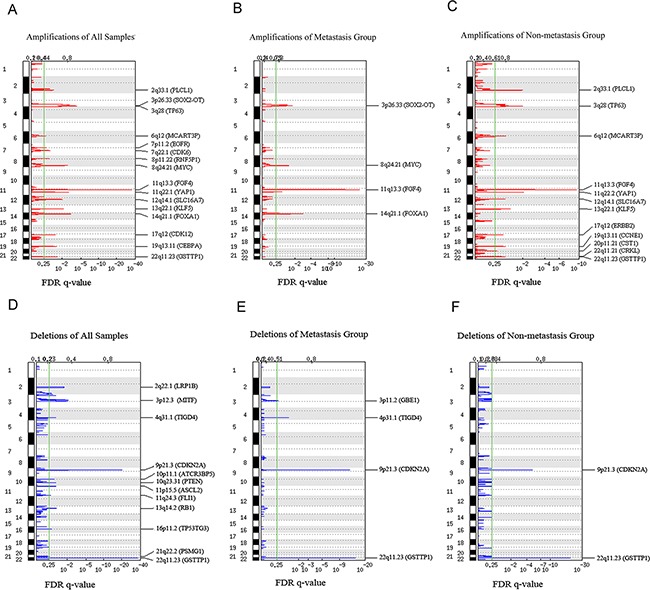
Figure 2. GISTIC analysis of copy number alterations in esophageal squamous cell carcinoma (ESCC).

False discovery rate (FDR) q-values are plotted along the x axis with chromosomal position along the y axis. Regions with q values < 0.25 (green lines) were considered significantly altered. Known or putative gene targets within the peak regions and the regions are indicated for significant peaks. A. Amplifications of all superficial ESCCs. B. Amplifications of superficial ESCCs with metastasis. C. Amplifications of superficial ESCCs without metastasis. D. Deletions of all superficial ESCC. E. Deletions of superficial ESCCs with metastasis. F. Deletions of superficial ESCCs without metastasis.
