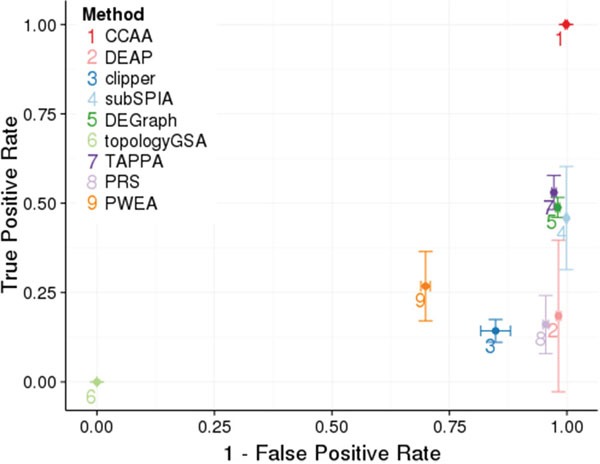
Figure 1. Comparison of performances of the different methods for defining pathways and calculating its activity.

CCAA is compared to DEAP [12], subSPIA [13], using their own software, and topologyGSA [14], DEGraph [6], clipper [5], TAPPA [15], PRS [16], PWEA [17], using the implementation available in the topaseq package [18]. The true positive rate has been estimated averaging the proportion of significant cancer KEGG pathways (Table 3) across the 12 cancers analyzed and is represented in the Y axis. Vertical bars in each point represent 1 SD of the true positive rate for the corresponding method. The false positive rate was estimated from 100 comparisons of groups (N=25) of identical individuals, randomly sampled from each cancer. The results obtained in the 12 cancers are used to obtain a mean value and an error. The X axis represents 1- the false positive rate. Horizontal bars represent in each point represent 1 SD of the false positive rate for the corresponding method.
