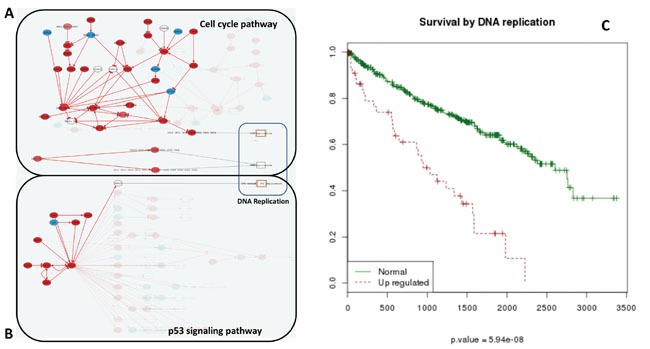
Figure 3. Increase of DNA replication activity is related to bad prognostic.

Effector nodes in two pathways trigger DNA replication in KIRC, as detected by the Hipathia program (http://hipathia.babelomics.org). Genes in red represent genes upregulated in the cancer with respect to the corresponding normal tissue; genes in blue represent downregulated genes and genes with no color were not differentially expressed. A. Cell Cycle signaling pathway with three effector circuits highlighted, one of them ending in the node containing proteins CDC6, ORC3, ORC5, ORC4, ORC2, ORC1 and ORC6, the second one ending in node with proteins CDC45, MCM7, MCM6, MCM5, MCM4, MCM3 and MCM2 and the last one ending in node with proteins ORC3, ORC5, ORC4, ORC2, ORC1, ORC6, MCM7, MCM6, MCM5, MCM4, MCM3 and MCM2. B. p53 signaling pathway with the effector circuit ending in protein RRM2B highlighted. C. Survival Kaplan-Meier (K-M) curves obtained for Uniprot function DNA replication.
