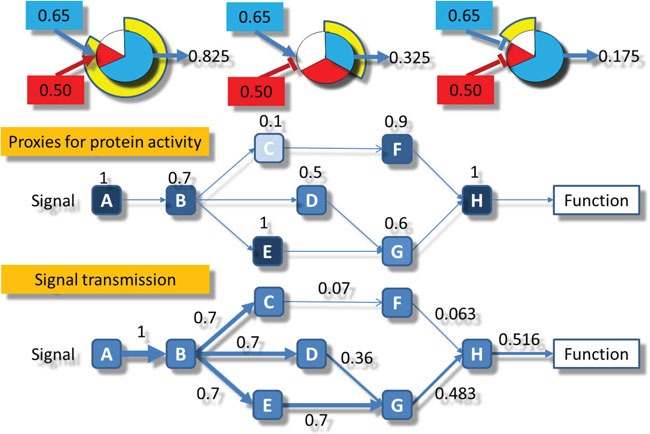
Figure 6. Schematic representation of the signal propagation algorithm used.

Upper part: the three types of activity transmitted: left) the combination of two activations, center) the combination of an activation and an inhibition and right) the combination of two inhibitions. Central part: the normalized values of gene expression are assigned to the corresponding nodes in the circuits. Lower part: the signal starts with a value of 1 in the receptor node A and is propagated by multiplying the weights assigned to each node in the central part following the rules depicted in the upper part.
