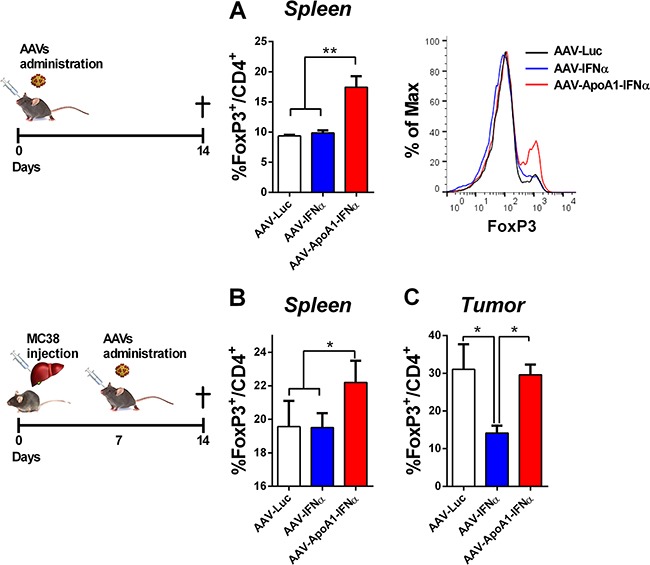
Figure 5. AAV-ApoA1-IFNα increases the FoxP3+ percentage in CD4+ T cells.

Flow cytometry analysis for the intracellular expression of FoxP3 in CD4+ T cells was performed in spleens of mice treated with AAV-Luc, AAV-IFNα and AAV-ApoA1-IFNα for two weeks A. Mice received an intrahepatic injection of MC38 and 5 days later were treated with the viruses. One week later, to analyse the FoxP3 in CD4+ T cells, flow cytometry was performed in spleen and intrahepatic tumors B. (n = 3, mice per group). Data were analysed by one way ANOVA, followed by the Bonferroni multiple comparison test **P< 0.01.
