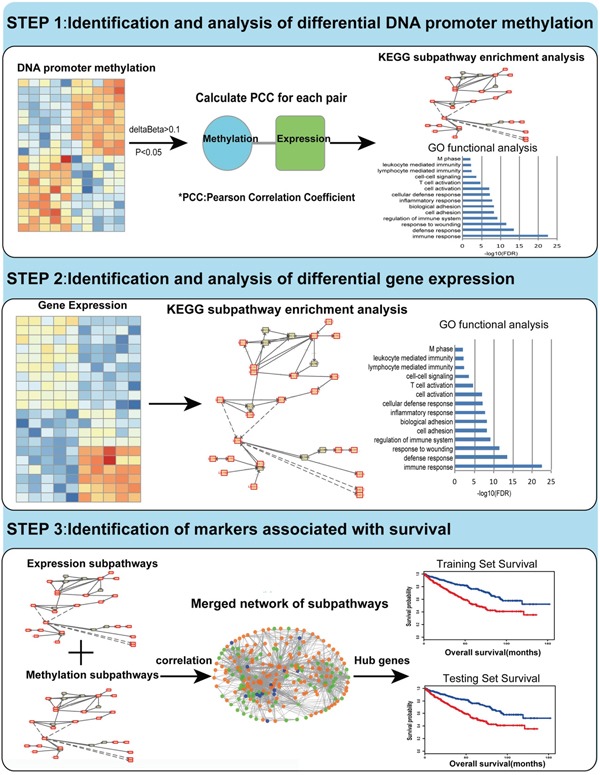
Figure 1. Flow figure indicating study design.

Step I: We identified and analyzed DMGs through TCGA methylation profiles. By using Pearson Correlation Coefficient method, we got the CpG sites which may influence gene expression. Then gene ontology (GO) functional analysis and KEGG subpathway enrichment analysis were performed for the DMGs. Step II: We identified and analyzed DEGs through mRNA expression profiles. GO functional analysis and KEGG subpathway enrichment analysis were performed for DEGs using the same method mentioned above. Step III: Based on topological property analysis of the integrated network, we identified candidate genes associated with the survival of KIRC both in the training set and testing set.
