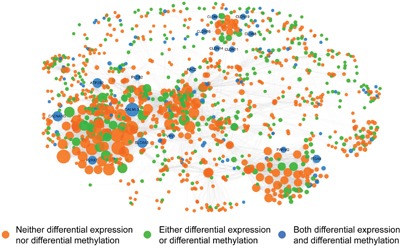
Figure 4. A methylation-associated and expression-related integrated network.

Orange nodes show the genes are neither DMGs nor DEGs. Green nodes show the genes are either DMGs or DEGs. Blue nodes show the genes are both DMGs and DEGs. The nodes in network represent genes and directed edges mean there is a correlation between genes in at least one subpathway. The nodes size represents its degree.
