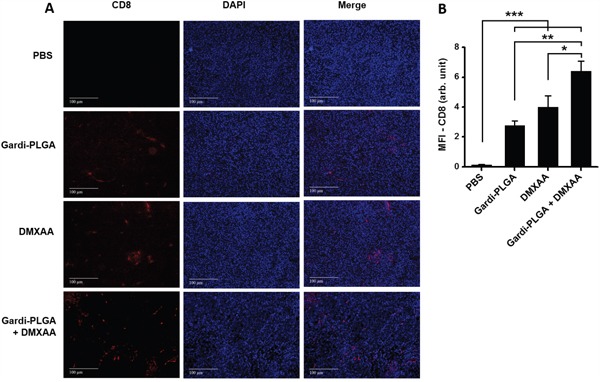
Figure 8.

A. Immunohistochemical images of tumor sections at day 14 after tumor inoculation for various treatment groups labelled with (left to right) T-cell marker (CD8, red), nuclear stain (DAPI, blue), and merged. B. Mean fluorescence intensity (MFI) of CD8 (n = 3 tumor sections, average of 10 different regions for each sample). There was significant increases of CD8 T cell infiltration in the DMXAA- and Gardi-PLGA-treated groups compared to PBS group, and further significant increase was observed in combination treated group. *p < 0.05, **p < 0.01, and ***p < 0.001 by one-way ANOVA Test, with Tukey's multiple comparison.
