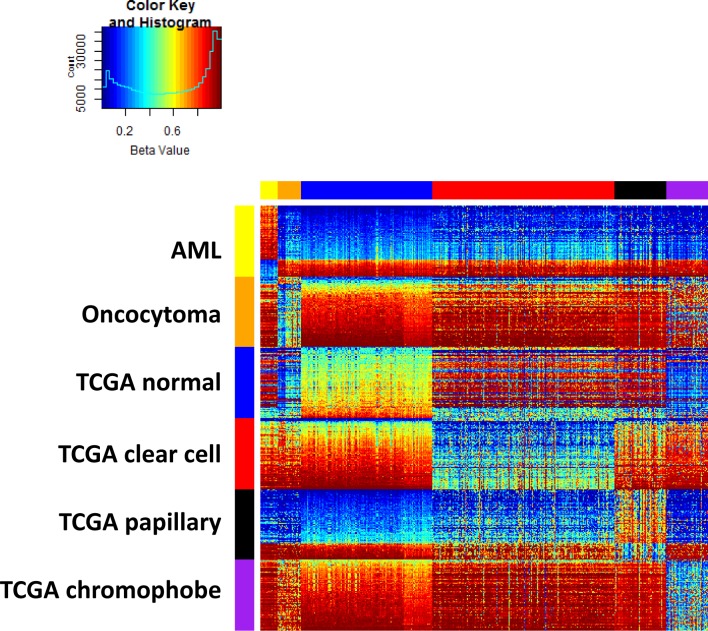
Figure 2. Training data set heatmap of 600 differentially methylated features (rows) in 697 kidney samples (columns).
Columns are ordered by tissue subtype, and rows are ordered by sets of predictive features. Within each feature set, rows are ordered by average DNA methylation level in normal kidney.

