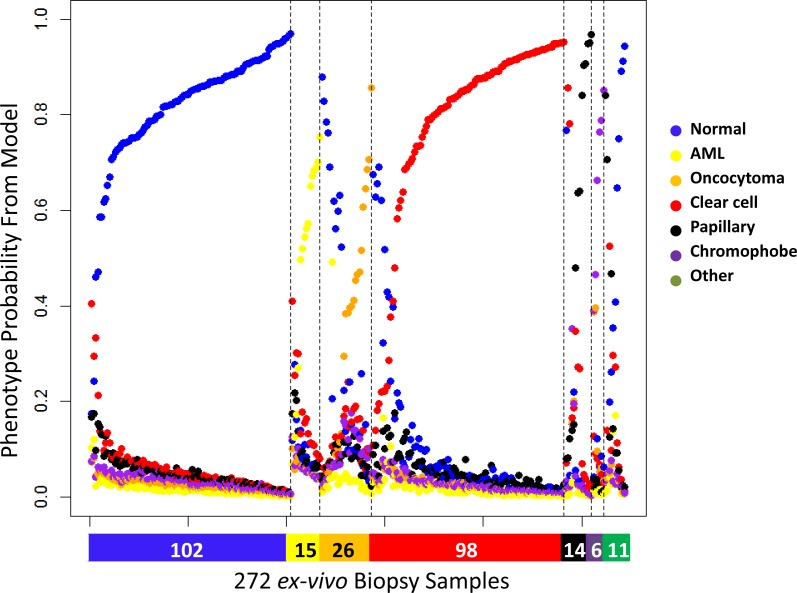
Figure 3. Six predicted probabilities for 272 ex vivo needle biopsy samples (102 normal kidney, 15 AML, 26 oncocytoma, 98 clear cell, 14 papillary, 6 chromophobe, 10 other benign, 1 other malignant).
Color bar at the bottom denotes the diagnosis by pathology (blue: normal, yellow: AML, orange: oncocytoma, red: clear cell, black: papillary, purple: chromophobe, green: other). The probabilities are ordered by subgroup and the probability the sample is assigned to the correct subgroup.

