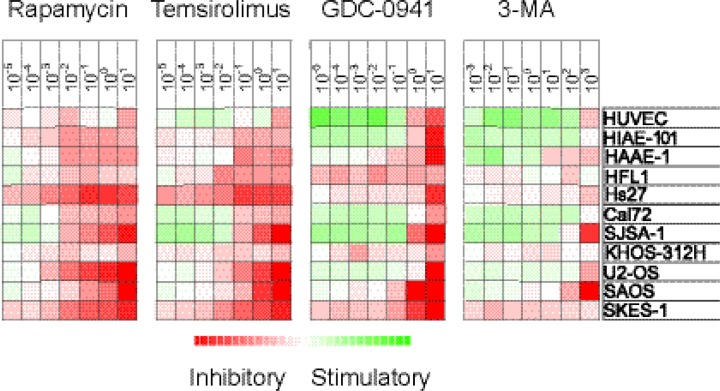
Figure 4. Antiproliferative effects of mTOR and PI3K inhibitors on stromal cells.
The effects of mTOR (rapamycin, temsirolimus) and PI3K inhibition (GDC-0941, 3-MA) on in vitro proliferation of 11 different stromal cell populations was investigated using the 3H-thymidine incorporation assay. Detectable proliferation was defined as >1000 cpm. Relative proliferation in drug-treated cultures versus the corresponding drug-free control cultures was converted to log(2) values. The different inhibitors and their concentration (μM) are shown at the top and the cell type is shown in the far right column. The heatmap shows the effects of the different inhibitors on proliferation, i.e. red color indicates decreased growth and green color growth enhancement.

