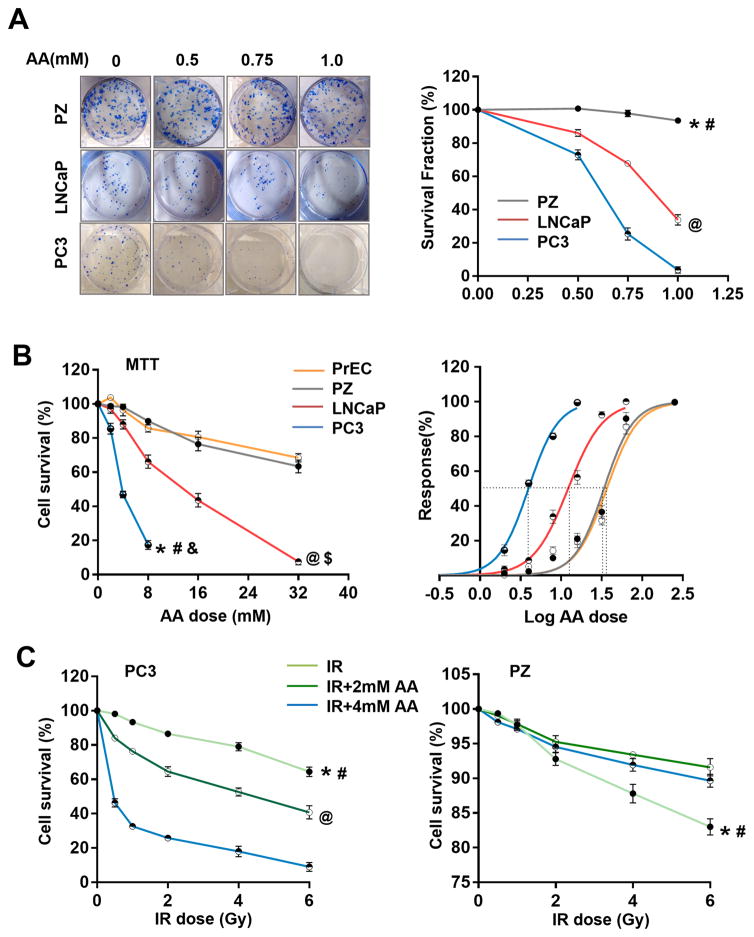
Figure 1.
The effect of AA on proliferation and radiosensitivity of prostate cancer and normal cells. A, Two prostate cancer cell lines (PC3 and LNCaP) and one prostate epithelial cell line (PZ) were treated with different concentrations of AA. Cell survival fraction was determined by colony survival analysis. *, # P<0.001 comparing PZ cells to PC3 (*) and LNCaP (#) cells, respectively. @ P<0.001 comparing LNCaP and PC3 cells. B, Two prostate cancer cell lines (PC3 and LNCaP) and two prostate epithelial cell lines (PZ and PrEC) were treated with different concentrations of AA. Cell survival fraction was determined by MTT assay. IC50 for each cell line was calculated based on the dose-response curve. *, #, & P<0.001 comparing PC3 cells to PZ (*), LNCaP (#) and PrEC (&) cells, respectively. @, $ P<0.001 comparing LNCaP cells to PZ (@) and PrEC ($) cells, respectively. C, Prostate cancer PC3 cells and prostate epithelial PZ cells were treated with IR and AA at indicated doses. Cell survival fraction was determined by MTT assay. *, # P<0.001 comparing IR group to IR+2mM (#) and IR+4mM (*) groups, respectively. @ P<0.001 comparing IR+2mM and IR+4mM groups. All the analyses were performed using linear regression models and Likelihood ratio tests with Bonferroni correction.

