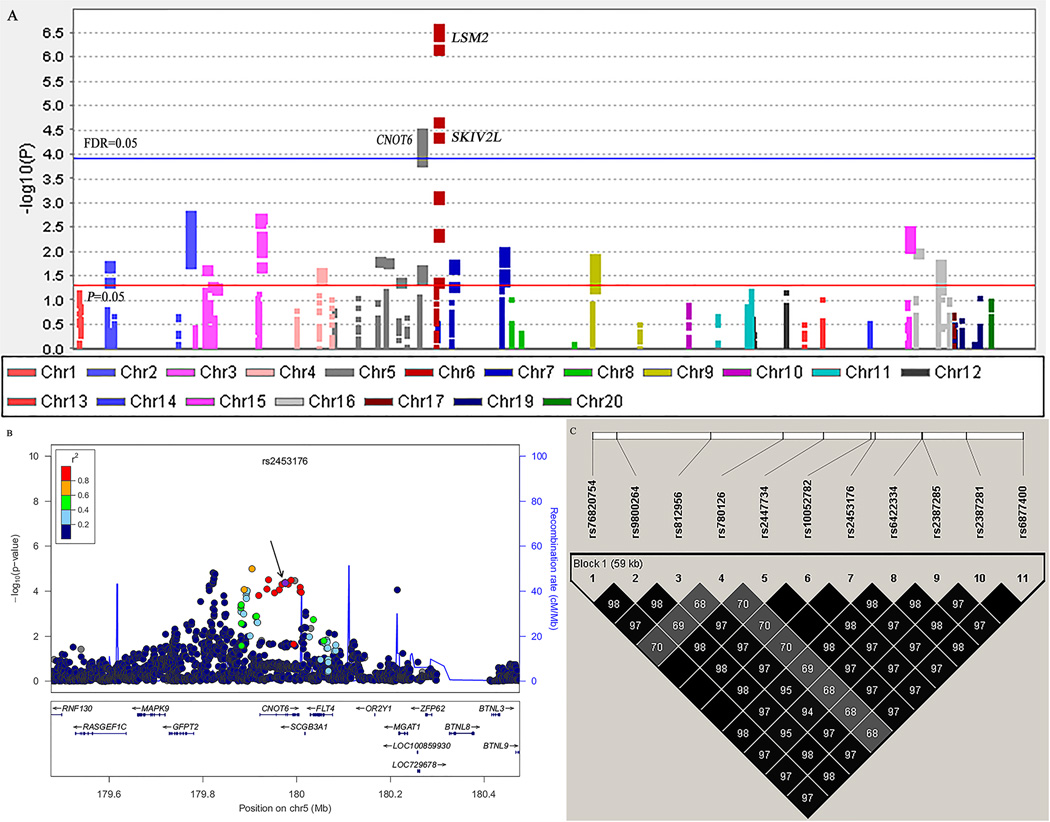
Figure 2. Screening of SNPs in the general mRNA degradation pathway.
A, Manhattan Plot of genome-wide association results from the general mRNA degradation pathway in TRICL. The x-axis shows SNPs’ positions on each chromosome. The y-axis shows the association P values with lung cancer risk (as –log10 P values). The FDR threshold of 0.05 was shown by a horizontal blue line. The P value of 0.05 was shown by a horizontal red line. B, Regional association plot for SNP rs2453176 in 500 kb up- and downstream region. The left-hand y-axis shows P values of the SNPs, which are transformed as −log10 (P) against chromosomal base pair positions. The right-hand y-axis shows the recombination rate estimated from HapMap Data Rel 22/phase II European population; C, The linkage disequilibrium plots of 11 SNPs in CNOT6. The value within each diamond represents the pairwise correlation between SNPs (measured as r2) defined by the upper left and the upper right sides of the diamond.

