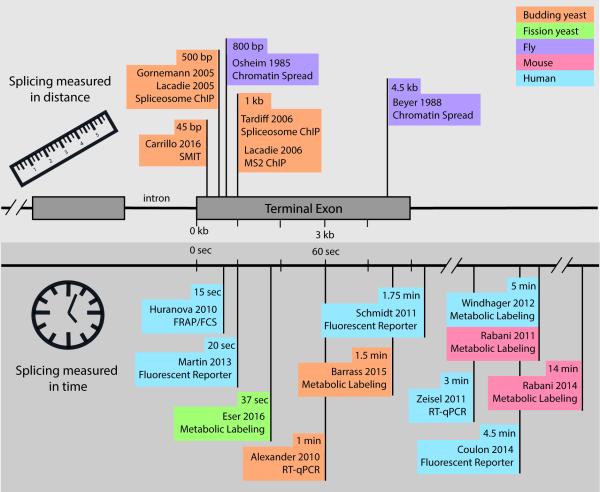
Figure 2. Comparison of distance-based and time-based measurements of splicing in vivo.
Many studies, indicated by flags on the gene ruler (upper panel) or time line (lower panel), have addressed when or where splicing occurs in multiple species and obtained the indicated results. This summary relates the measured half-maximum splicing values (or similar value if half-max not provided). Translation of distance to time is herein assumed at 3 kb/min (78). See text for details.

