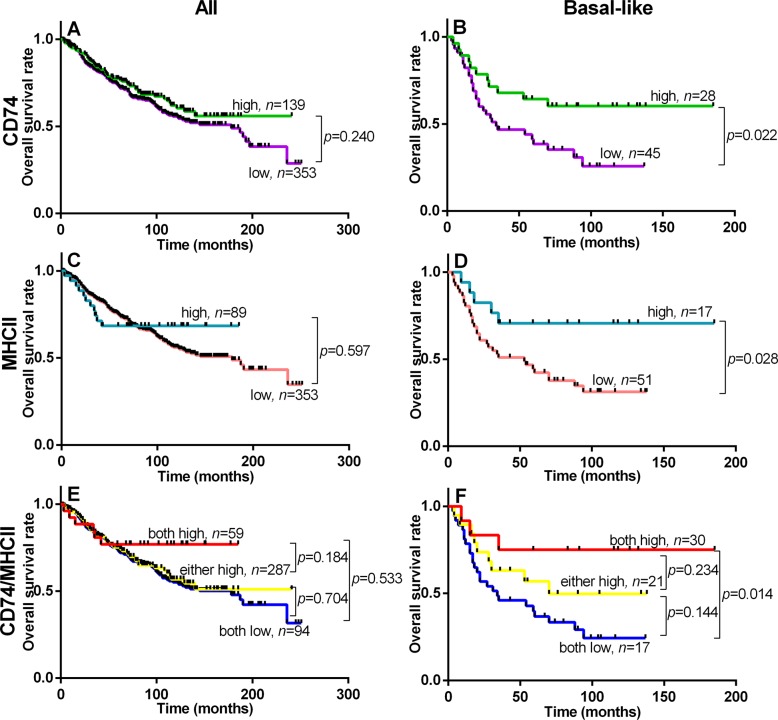
Figure 2. Overall Survival within entire cohort (All, left column) and Basal-like subgroup (Basal-like, right column) relative to status of CD74 (panels A and B), MHCII (panels C and D), and CD74/MHCII combined (panels E and F).
Kaplan Meier plots are shown with logrank test p values and n = total number of subjects within each curve.

