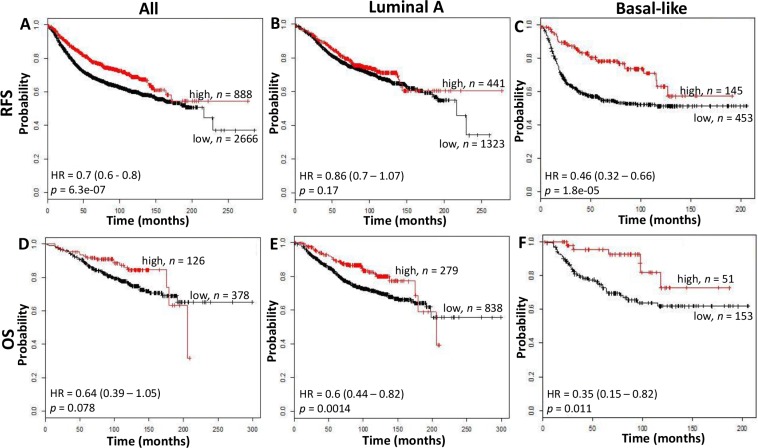
Figure 3. The relation between CD74 and Relapse Free Survival (RFS, top row) and Overall Survival (OS, bottom row) was analyzed in a breast cancer cohort using the kmplotter tool.
RFS and OS were assessed in all cases (panels A and D), Luminal A subgroup (panels B and E), and Basal-like subgroup (panels C and F) using the Jetprobe set for CD74 (Affymetrix ID: 209619) and a cutpoint at the 75th expression quartile. Kaplan Meier plots are shown with hazard ratios (HR) and logrank test p values and n = total number of subjects within each curve.

