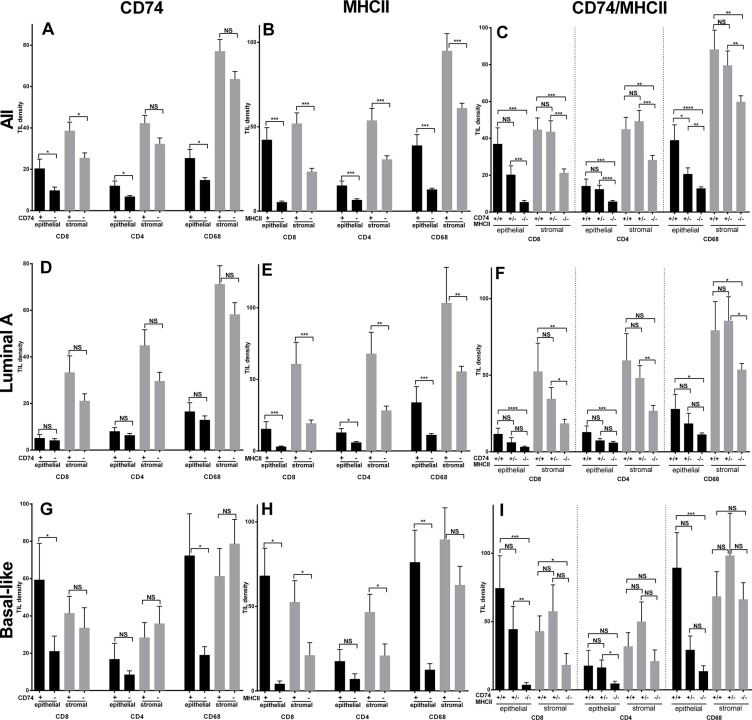
Figure 4. Tumor infiltrating leucocyte (TIL) cell densities in entire cohort (All, top row) and Luminal A subgroup (middle row) and Basal-like subgroup (bottom row) relative to positive and negative status of CD74 (panels A, D, G), MHCII (panels B, E, H), and CD74/MHCII combined (panels C, F, I).
Bars represent means +/– standard error. Black and grey bars represent intra-epithelial and intra-stromal densities of CD8, CD4, and CD68 positive TIL respectively. NS = no significance, *p ≤ 0.05, **p ≤ 0.01, ***p ≤ 0.001, ****p ≤ 0.0001.

