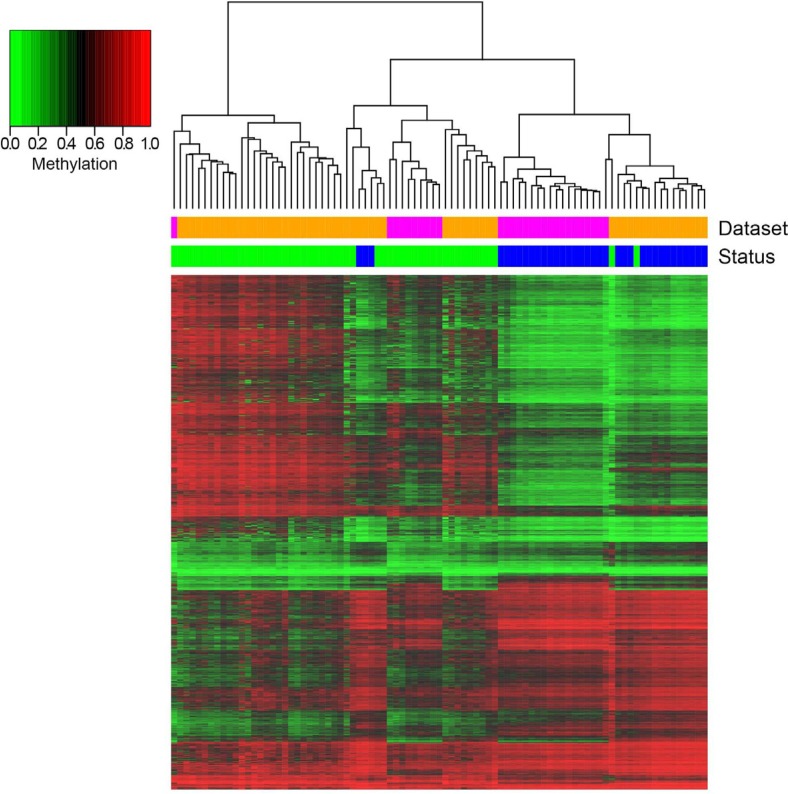
Figure 1. Hierarchical clustering of DMRs resulting from the comparison N1xADE and heatmap representation of their methylation values.
Columns correspond to samples, rows correspond to DMRs (for graphical purposes only the top significantly differential CpG of each BOP is reported). Color bars indicate the status of the samples (blue: N1; green: ADE) and the dataset of origin (orange: Luo; magenta: Timp).

