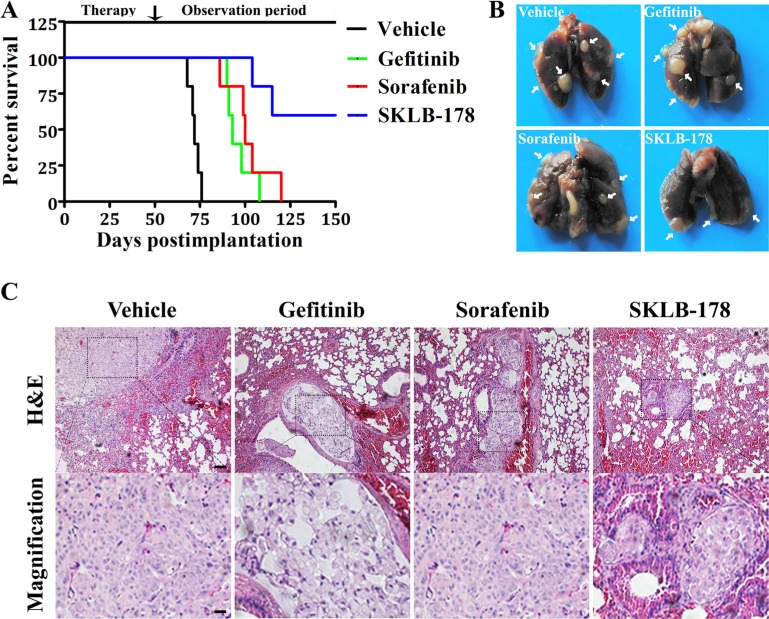
Figure 6. Anti-metastatic activity of SKLB-178 in A549 intravenous implantation model.
(A) Kaplan-Meier survival curves. (B) Representative images of intact lungs from dead mice in every group. The white arrows indicate metastatic nodules. (C) H&E staining of lungs from mice that died in every treatment group. Scale bars represent 100 μm and 25 μm for low and high magnification, respectively.

