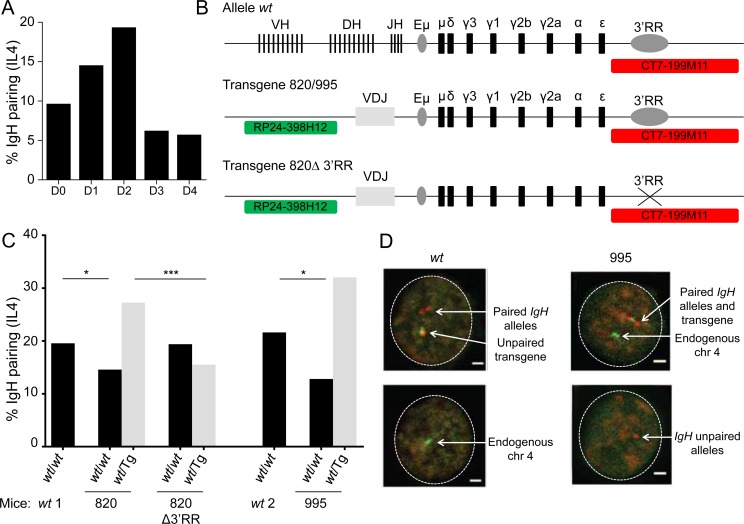
Figure 1. 3′RR dependent IgH pairing in wt and transgenic B-cells.
A. Kinetic of IgH alleles pairing in in vitro activated wt B-cells. Wt B splenocytes were stimulated 4 days in vitro with anti-CD40 + IL4 and IgH localization was studied by 3D FISH. IgH pairing (distance ≤ 1 µm) was quantified in resting (day 0) and activated B cells (D1, D2, D3, D4). Bars represent % of pairing from 2 experiments with at least 585 cells analyzed. B. Schematic representation of alleles and probes used for 3D FISH experiments (not scaled). Wt alleles contain all V(D)J genes, constant genes and 3′RR, transgenes include a rearranged VDJ gene, constant genes and 3′RR (820 and 995 transgenes) or not (820Δ transgene). Probes are specific for IgH (CT7-199M11, red) or for transgene integration site (RP24-398H12, green, chromosome 4). C. IgH pairing in in vitro activated B lymphocytes. Cells were analyzed at day 2 and IgH pairing (distance ≤ 1 µm) between wt and wt alleles (black) or between wt and transgenic alleles (grey) were quantified by 3D FISH. In a first set of experiments wt cells (wt1) were compared to 820 and 820Δ transgenic cells and in a separated experiment wt cells (wt2) were compared to 995 transgenic cells. Bars represent % of pairing from 2 experiments, with at least 50 cells per group. DNA probes used were BAC CT7-199M11 for 3´ IgH and BAC RP24-221C18 close to the insertion site of the IgH transgene on chromosome 7 or BAC RP24-398H12, which is located adjacent to the insertion site of the IgH transgene on chromosome 4. Fisher exact test for significance. D. Representative nuclei from 3D FISH experiments on in vitro activated B-cells (day 2). Examples of pairing between endogenous IgH alleles in wt cells and between transgene and IgH alleles in 995 transgenic cells are shown. IgH loci are in red, transgene and endogenous chromosome 4 are in green. Scale bar: 1µm.

