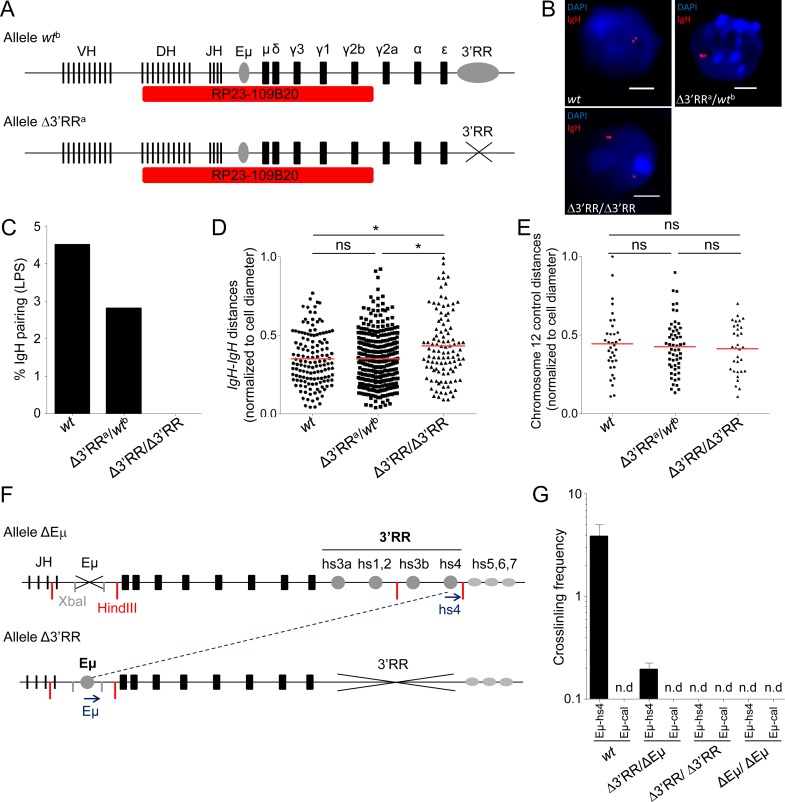
Figure 2. 3′RR-dependent IgH inter-allelic interactions in wt, 3′RR hemizygous and 3′RR-deficient B cells.
A. Schematic representation of IgH alleles and probe (RP23-109B20, red) used for 3D FISH experiments (not scaled). Wtb allele includes the 3′RR, contrary to the Δ3′RRa allele. B. Representative nuclei from 3D FISH experiments on in vitro LPS activated B-cells (day 3). Examples of pairing observed in wt and Δ3′RRa/wtb cells, Δ3′RR/Δ3′RR failed to pair their IgH alleles. DAPI is in blue, IgH loci are in red. Scale bars: 4µm. C. IgH pairing in in vitro LPS activated B lymphocytes. Cells were analyzed at day 3 and IgH pairing (distance ≤ 1 µm) between alleles was quantified by 3D FISH. Bars represent % of pairing from at least 2 experiments, corresponding to 138 (wt), 107 (Δ3′RR) and 324 (Δ3′RRa/wtb) cells analyzed. D. Distribution of IgH inter-allelic distance in activated B-cells (with normalization according to cell diameter) from wt, Δ3′RR and Δ3′RRa/wtb cells are shown (from the same cells as in 2C). Mean is shown and KS test for significance. E. Distribution of inter-allelic distance (with normalization according to cell diameter) analyzed for a non-IgH chromosome 12 locus (probe RP23-436M24) in activated B-cells from wt (n = 35), Δ3′RR (n = 32) and Δ3′RR/wt (n = 56). (> 2 experiments with > 3 mice per group). Mean is shown and KS test for significance. F. Schematic representation of IgH ΔEµ and Δ3′RR alleles used for 3C experiments. Primers (blue arrows), XbaI (grey) and HindII (red) restriction sites are shown (not to scale). G. Relative inter-allelic interactions between IgH alleles determined by 3C experiments. Eµ-hs4 or Eµ-calreticulin (Eµ-cal) 3C crosslinking frequencies for wt, Δ3′RR/Δ3′RR, ΔEµ/ΔEµ and double heterozygous Δ3′RR/ΔEµ mice were determined from in vitro LPS activated B-cells (2 experiments with ≥ 3 mice per group). Mean is shown +/- s.e.m. (n.d., non-detected).

