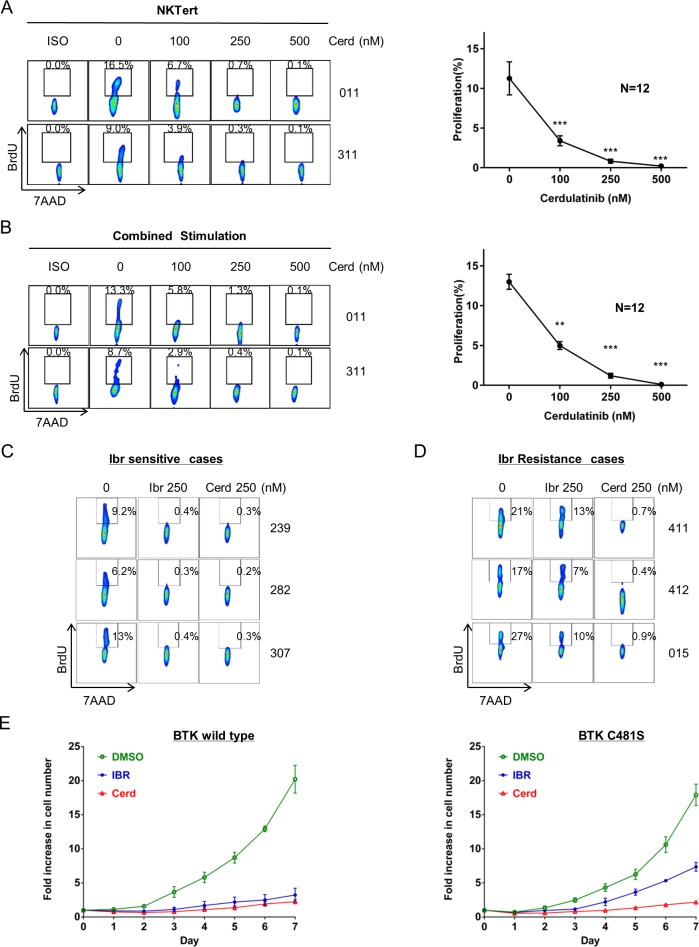
Figure 4. Cerdulatinib blocks proliferation of ibrutinib-sensitive and ibrutinib-resistant primary CLL cells.
A. Cell proliferation following increasing concentrations of cerdulatinb in the presence of NKTert co-cultures. BrdU incorporation was measured following 20 days of treatment. Left panel, two representative cases are shown. Right panel, aggregate data of 12 CLL cases analyzed with ANOVA test. Values in the line graph represent mean+SE. ***P < 0.001. B. Cell proliferation following increasing concentrations of cerdulatinb in the presence of combined stimulation. Cells were treated with plate-bound anti-IgM combined with IL4, CD40L and CpG in the presence of cerdulatinib and BrdU for 8 days followed by flow cytometric analysis for BrdU incorporation. Left panel. two representative cases are shown. Right panel, aggregate data of 12 CLL cases analyzed with ANOVA test. Values in the line graph represent mean+SE. **P < 0.01 and ***P < 0.001. C. Sensitivity of three ibrutinib-sensitive cases to cerdulatinib. A low in vivo achievable concentration of 250 nM was chosen to match that of ibrutinib. D. Sensitivity of three ibrutinib-resistant (both clinically resistant and resistant by this assay) to cerdulatinib. (C&D) Cells were treated with either 250 nM ibr or cerdulatinib in the presence of combined stimuli. BrdU incorporation was measured at day 8. E. Effects of ibrutinib and cerdulatinib in WT BTK-transfected TMD8 cells (Left) and in BTKC481S -transfected cells (Right). 250nM of ibrutinib or cerdulatinib was added into the culture and live cell number was counted daily for 7 days. The results shown are the mean+SE of 4 replicate experiments.

