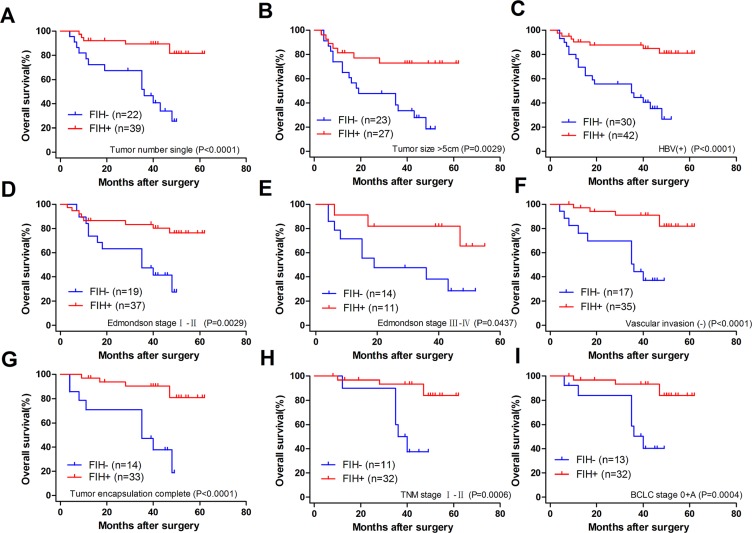
Figure 5. Overall survival Kaplan-Meier curves for patients with different clinicopathological characteristics according to FIH expression level in TAMs.
(A) OS of the patients with single tumor. 25.510% in FIH(–) vs. 81.525% in FIH(+), p < 0.0001. (B) OS of the patients with tumor size > 5 cm. 18.599% in FIH(–) vs. 72.754% in FIH(+), p = 0.0029. (C) OS of the patients with HBV (+). 26.561% in FIH(–) vs. 81.080% in FIH(+), p < 0.0001. (D) OS of the patients with Edmondson stage I–II. OS 27.632% in FIH(–) vs. 76.246% in FIH(+), p = 0.0029. (E) OS of the patients with Edmondson stage III–IV. 28.571% in FIH(–) vs. 65.455% in FIH(+), p = 0.0437. (F) OS of the patients with no vascular invasion. 36.953% in FIH(–) vs. 81.802% in FIH(+), p < 0.0001. (G) OS of the patients with complete tumor encapsulation. 18.857% in FIH(–) vs. 80.875% in FIH(+), p < 0.0001. (H) OS of TNM I-II stage. 37.500% in FIH(–) vs. 83.986% in FIH(+), p = 0.0006. (I) OS of the patients with BCLC 0+A. 40.280% in FIH(–) vs. 83.986% in FIH(+), p = 0.0004. Log-rank test was used.

