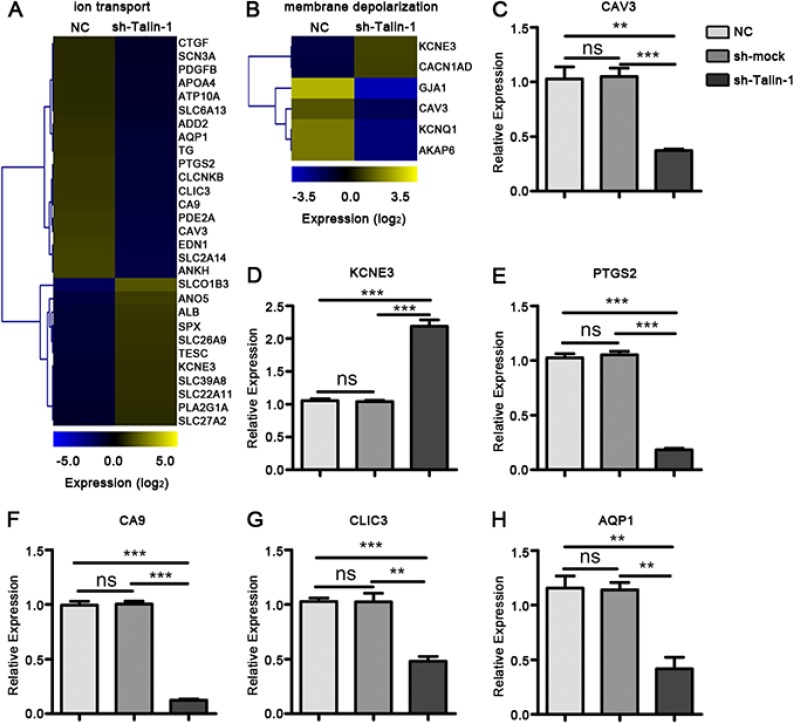
Figure 3. Talin-1 promotes ion transport and membrane depolarization in HCC.
(A, B) Heat maps of genes changed by two fold or more after Talin-1 knockdown involved in (A) ion transport and (B) membrane depolarization. The signal value of the genes is higher in yellow box than in blue ones. (C–G) Expression of selected genes involved in ion transport and membrane depolarization are measured by qRT-PCR. (C) CAV3, (H) AQP1, (E) PTGS2, (F) CA9 and (G) CLIC3 were down-regulated while (D) KCNE3 was up-regulated in the sh-Talin-1 group compared with the NC and sh-smock groups. *P < 0.05 **P < 0.01, and ***P < 0.001. The data are presented as the mean ± SEM.

