
Figure 1. Effect of 5-FU on hepatocellular viability and lipid accumulation.
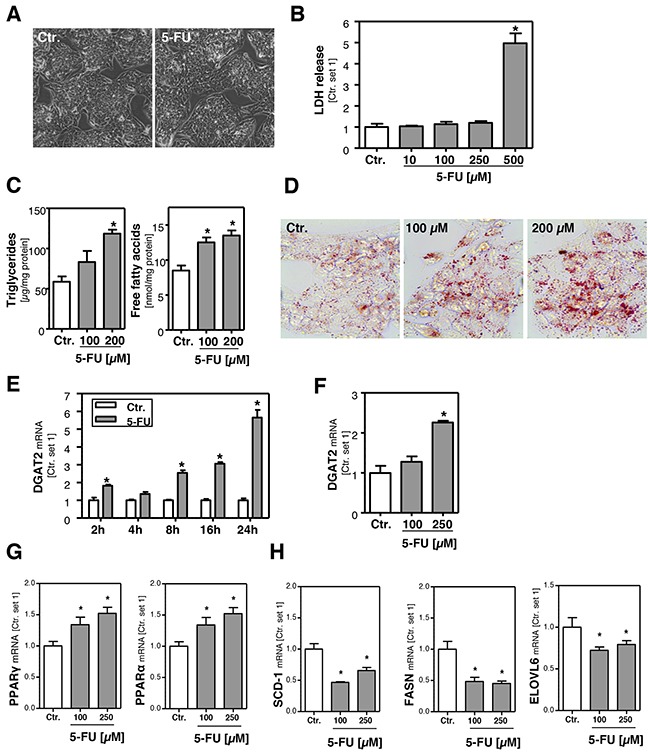
A. Microscopic images of HepG2 cells incubated with 5-FU (250 μM) for 24 h and control cells. B. Quantification of LDH release into the supernatant of HepG2 cells treated with different 5-FU doses as indicated. C. Analysis of intracellular triglycerides and free fatty acids content normalized to total cellular protein. D. Oil red O staining of HepG2 cells incubated with 5-FU for 24 h and control cells. Furthermore, HepG2 cells were incubated with 5-FU (200 μM) for different times as indicated. Moreover, cells were incubated with two different 5-FU doses for 24 h. Analysis of mRNA levels of E, F. DGAT2, G. PPARγ and PPARα and H. SCD-1, FASN and ELOVL6 by quantitative RT-PCR (*: p<0.05 compared to control).