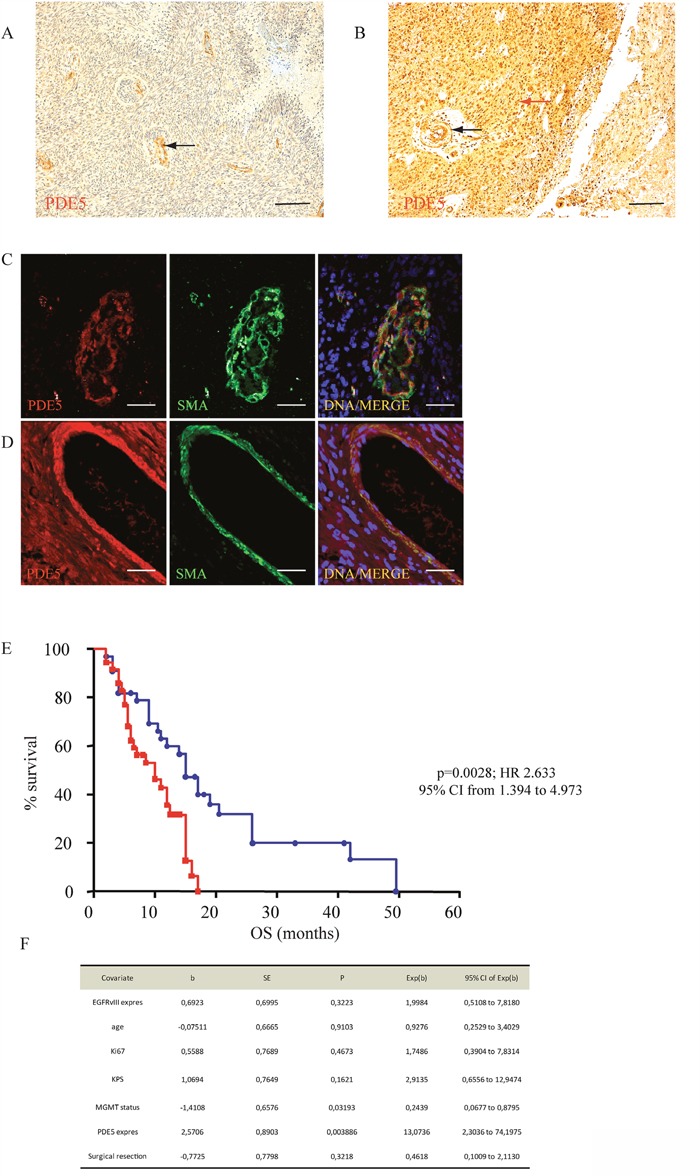
Figure 1. PDE5 expression correlates with OS in GBM.

A. PDE5 negative and B. PDE5 positive GBM samples, as revealed by immuno-histochemistry. Red arrow points to positive cancer cells, black arrows point to positive vascular smooth muscle cells. Scale bar=50μm, 100X magnification. PDE5 and smooth muscle actin (SMA) expression in smooth muscle cells in a PDE5 negative C. and in a PDE5 positive D. GBM sample. Scale bar=10μm. E. Kaplan–Meier curves representing the OS of 69 patients affected by GBM, (PDE5 positive, blue circles; PDE5 negative, red squares) after TMZ and X-ray treatments. F. The hazard ratios and 95% confidence intervals were calculated using a multivariable-adjusted Cox model, and the p values were calculated using a two-sided log-rank test.
