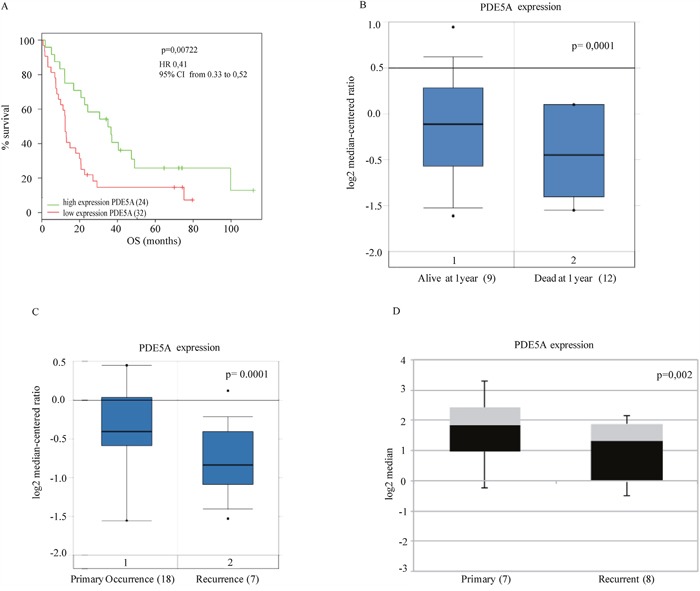
Figure 2. Clinical association of PDE5A gene expression with survival of GBM patients from public datasets.

A. The association between expression levels of PDE5A and OS was evaluated by Kaplan–Meier analysis B. and gene expression analysis to 1 year by box-plot graph, respectively in two public datasets [24, 25] (56 and 21 patients, respectively). Statistically significant results (p-value < 0.05) are indicated. The hazard ratios and 95% confidence intervals were calculated using a multivariable-adjusted Cox model, and the p values were calculated using a two-sided log-rank test. C. PDE5A expression levels from 25 GBM patients obtained from the public dataset of Liang et al. [24]. Casuistry samples have been divided between «primary occurrence» (18 patients) and «recurrence» (7 patients). PDE5A mRNA expression levels in these samples are reported in the box-plot. A statistically significant correlation is shown between PDE5 mRNA low levels and the GBM's relapse. D. PDE5A expression analysis of cell lines derived from primary (7) and recurrent glioblastomas (8) with resistance to O(6)-alkylating agents, BCNU and TMZ is shown as box plot graph. The expression values are processed by the public repository dataset of Bredel et al. [55].
