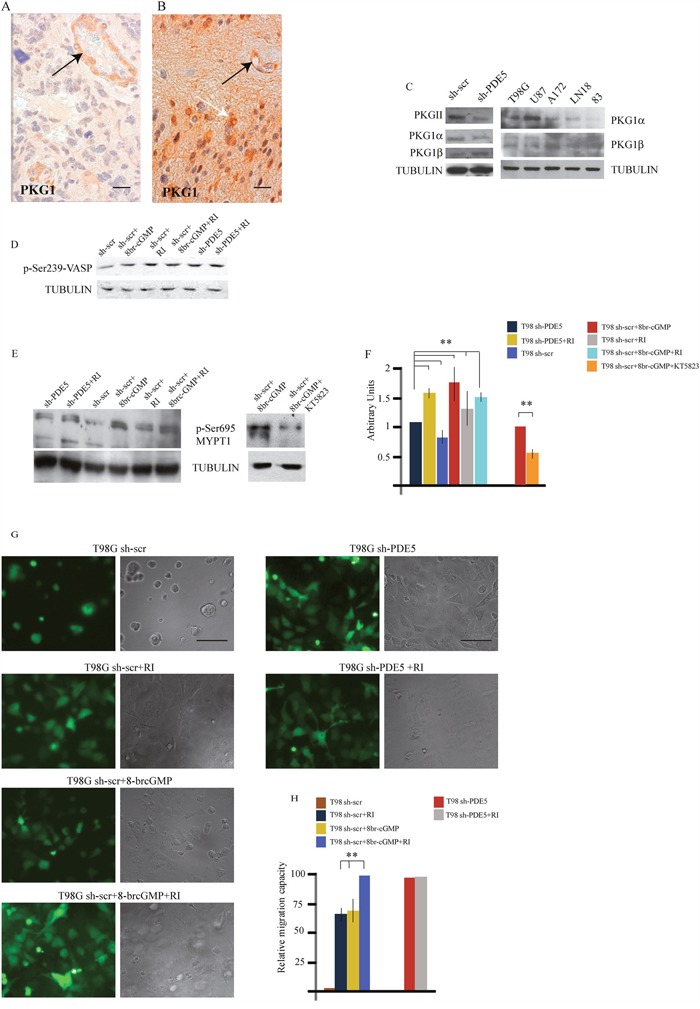
Figure 4. PKG expression and MYPT1 phosphorylation regulates GBM cells migration.

A. PKG1 low and B. PKG1 high GBM samples, as revealed by immuno-histochemistry. Black arrows point to PKG1 expression within the vessel walls. White arrow points to tumor cells. Scale bar=20μm. C. Expression levels of PKGII, PKG1α and PKG1β and total PKG1 in sh-scr and sh1-PDE5 T98G cells and in wtT98G, U87MG, A172, LN18, 83 GBM lines. D. pVASP levels in sh-scr or sh1-PDE5 T98G cells before and after Y-27632, 8br-cGMP (50 μM) treatments. Representative image out of 4 independent experiments. E. Phosphorylation levels of MYPT1 (pSer695) in sh-PDE5 or sh1-scr T98G upon the indicated treatments [8br-cGMP, 50 μM; Y-27632 (RI), 10 μM); KT5823 (PKGi), 2 μM]. F. Densitometric analysis of western blots from three independent experiments is shown. Bars represent the mean ±SD. G. sh-scr and sh1-PDE5 T98G invasion assays on matrigel cushions in the presence of Y-27632 or 8br-cGMP or both. H. Histogram showing the relative migration capacity (fold increase ± SD) of cells that reached the bottom of the matrigel cushion in the different treatments compared to control cells. (**p < 0.001).
