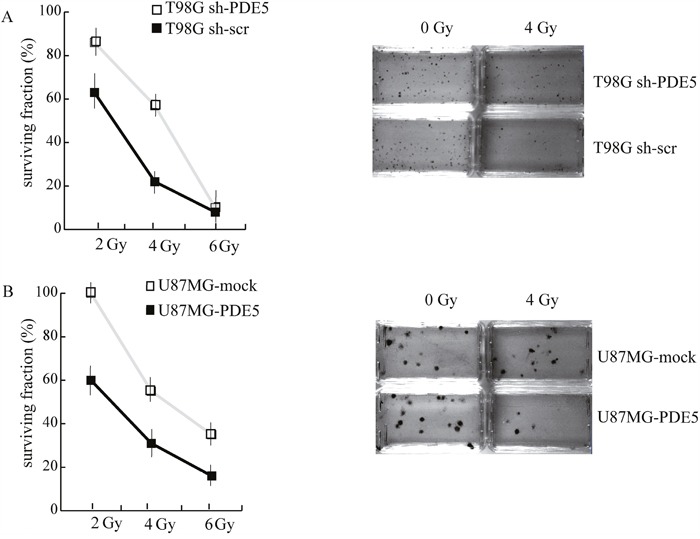
Figure 5. Effect of PDE5 on DNA repair and cell survival upon ionizing radiation.

A. Left: survival curves of sh-scr (black squares) or sh1-PDE5 T98G cells (empty squares) exposed to increasing X-ray doses from 2 to 6 Gy. Right: representative images of clonogenic assays in untreated control cells or in cells exposed to 4 Gy. B. Left: survival curves of PDE5-overexpressing (black squares) or mock-expressing U87MG cells (empty squares) exposed to increasing X-ray doses from 2 to 6 Gy. Right: representative images of clonogenic assays in untreated control cells or in cells exposed to 4Gy.
