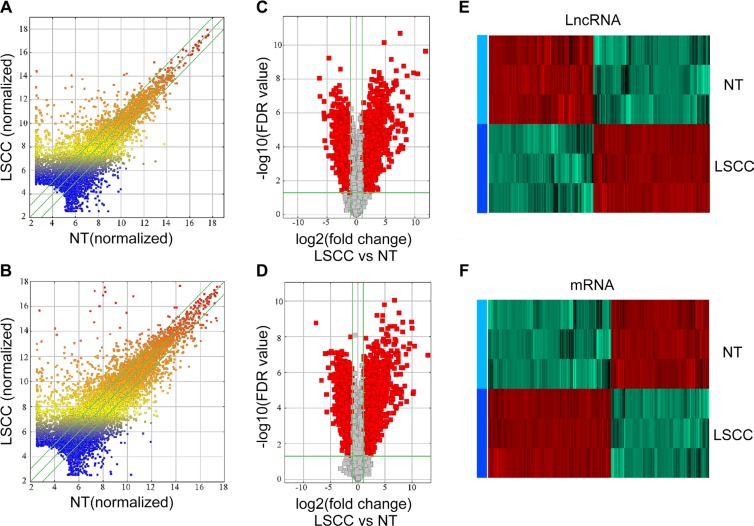
Figure 1. Expression profiles of lncRNAs and mRNAs in LSCCs compared with NT samples.
(A and B) Scatter-plot of variation in expression of lncRNAs and mRNAs between early stage LSCC tissues and NT samples. X and Y axes are the mean normalized signal values (log2 scaled). The green lines are fold change lines (the default fold change value given is 2.0). (C and D) The Volcano plot of differently expressed lncRNAs and mRNAs in LSCC relative to NT samples. The vertical green lines represent 2.0-fold changes up and down and the horizontal green line represents a FDR-value of 0.05. The red points in the plot represent the differentially expressed lncRNAs with statistical significance, X axes are the Fold change values (log2 scaled), Y axes are the FDR-values (log2 scaled). (E) and (F) Hierarchical clustering analysis of lncRNAs and mRNAs.

