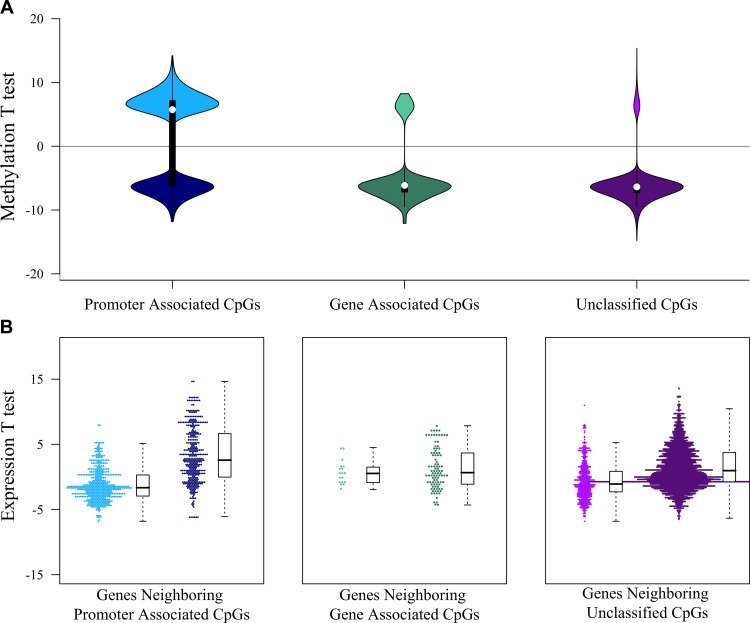
Figure 4. Interaction between DNA methylation and gene expression landscapes.
(A) Distribution of the DNA methylation test statistics (HPV-inactive vs. HPV-active) of the significant differently methylated CpGs. The majority of gene-associated and unclassified CpGs were hypomethylated in HPV-inactive tumors (negative test statistic), whereas promoter-associated CpGs were equally divided between hypermethylated (positive test statistic) and hypomethylated (negative test statistic). (B) Distribution of the gene expression test statistics (HPV-inactive vs. HPV-active) of the genes associated with significant differently methylated CpGs. Test statistics (and expression levels) of genes near gene-associated or unclassified CpGs were not correlated with CpG methylation levels, whereas test statistics (and expression levels) of genes near promoter-associated CpGs were inversely correlated with CpG methylation levels.

