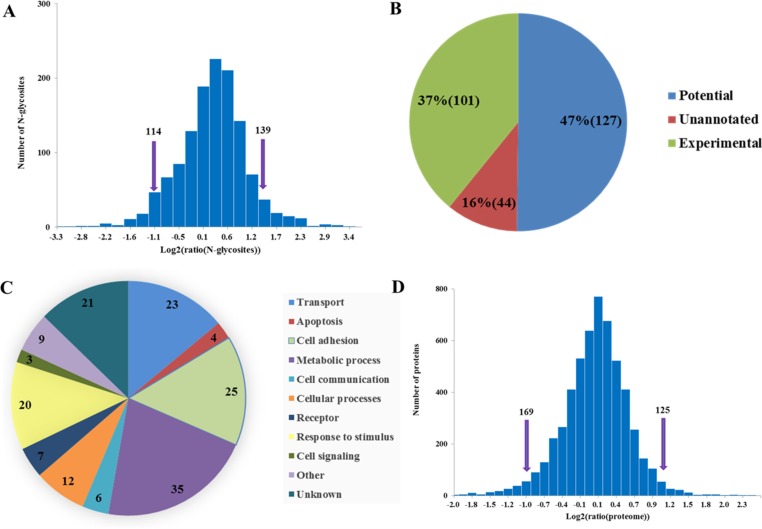
Figure 4. Comparative analyses of N-glycosylation level and proteome between NCI/ADR-RES and OVCAR8 cells.
(A) Log2 ratio distributions for N-glycosites analyzed, note that greater than 1 or less than −1 were considered significant. (B) Significantly changed N-glycosites (253) match to Uniprot database annotations. (C) Functional annotation of glycoproteins with significantly changed N-glycosite-containing peptides. (D) Log2 ratio distributions for proteome analyzed, note that greater than 1 or less than −1 were considered significant.

