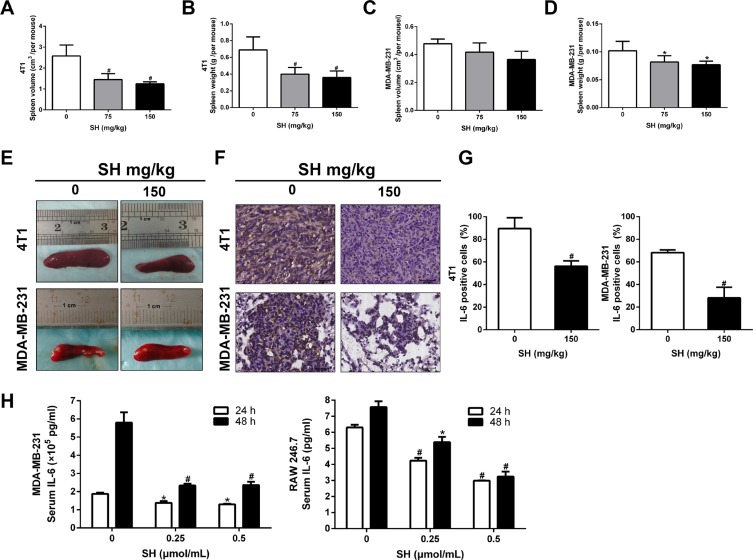
Figure 7. SH attenuated inflammation response elicited by breast cancer cells.
(A) Spleen volumes and (B) spleen weight of the control group, 75 mg/kg and 150 mg/kg SH groups in the 4T1 mouse model. (C) Spleen volumes and (D) spleen weight of the control group, 75 mg/kg and 150 mg/kg SH groups in the MDA-MB-231-luc mouse model. (E) Representative spleen pictures. (F and G) IL-6 expression analysis by IHC. (H) IL-6 secretion of cells was tested using ELISA. MDA-MB-231 cancer cells and RAW 246.7 murine macrophages were treated with SH and the supernatant was used to test IL-6 secretion. Data are represented as mean ± S.D. of three independent experiments. *P < 0.05, #P < 0.01, SH treated group compared with the untreated control group.

