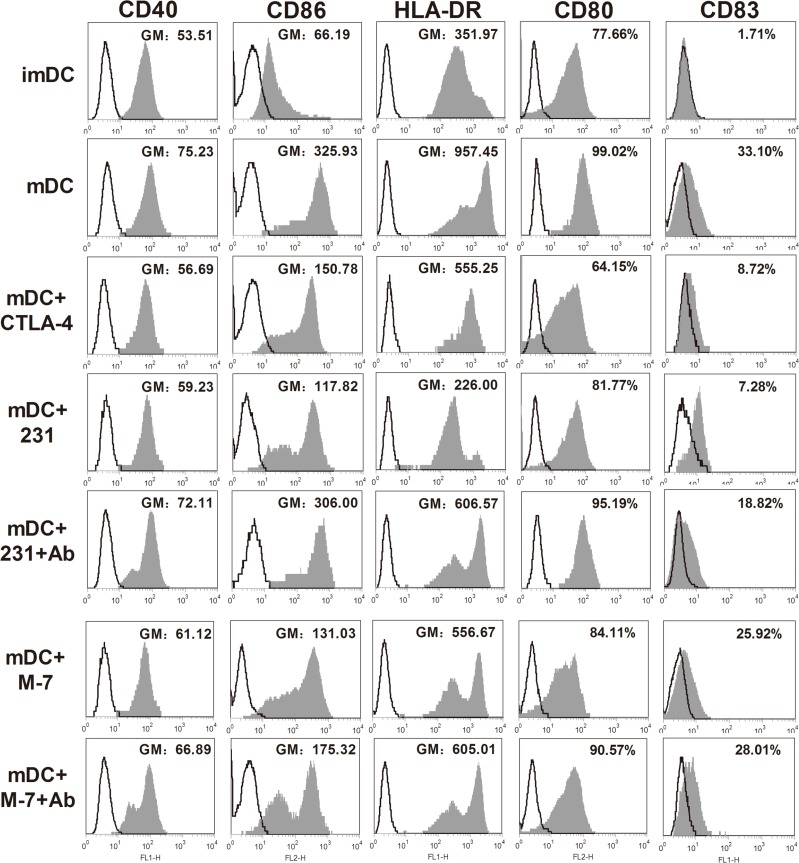
Figure 2. Phenotypic properties of DCs from different treatment groups.
MDA-MB-231 (231) and MCF-7 (M7) cell lines were used for examining the effects of CTLA-4+ BCCs on DCs. Maturation status of DCs was monitored through examining the surface expression of CD40, CD80, CD83, CD86 and HLA-DR. Cancer cells were excluded from analysis by gating on CD11c+DCs. DCs were cultured in medium alone, or with soluble CTLA-4-Fc (mDC+CTLA-4), or cocultured with BCCs alone (mDC+231, mDC+M7) or in presence of CTLA-4 mAb (mDC+231+Ab, mDC+M7+Ab), the expression of the surface markers was assayed by flow cytometry. Histograms illustrated staining with isotype-matched control (fine black line) and the positive cells (solid profiles). In these histograms, the expression of CD40, CD86, HLA-DR were presented as geometric mean fluorescence intensities (GM), while the expression of CD80 and CD83 were presented as gated cells (%). Results are representative of at least three independent experiments.

