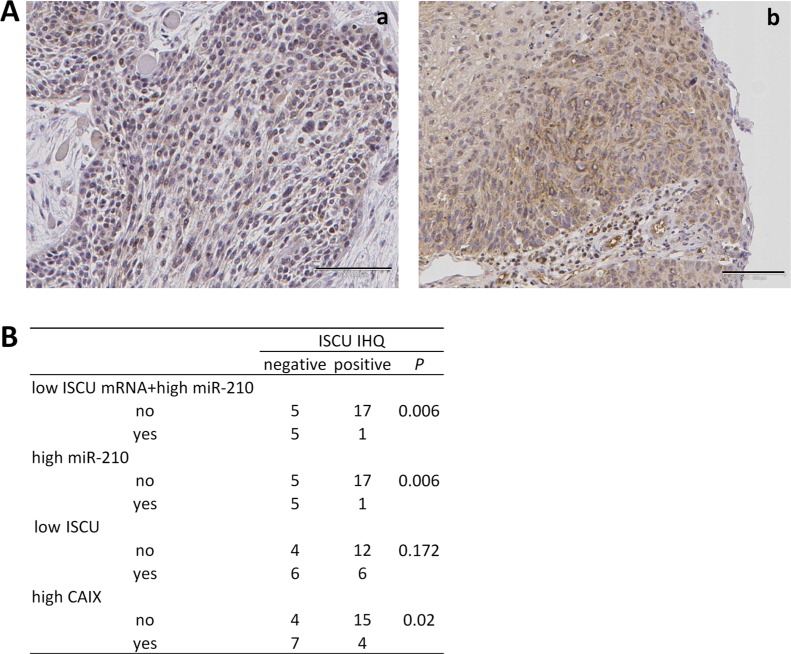
Figure 5. Correlation between decreased ISCU protein and increased miR-210 levels.
(A) Representative photomicrographs of SCC tumor biopsies immunostained for ISCU. Images correspond to tumor tissues with (a) and without (b) low ISCU mRNA+high miR-210 levels. Original magnifications ×100. (B) Correlation between ISCU mRNA and protein levels, miR-210 and CAIX.

