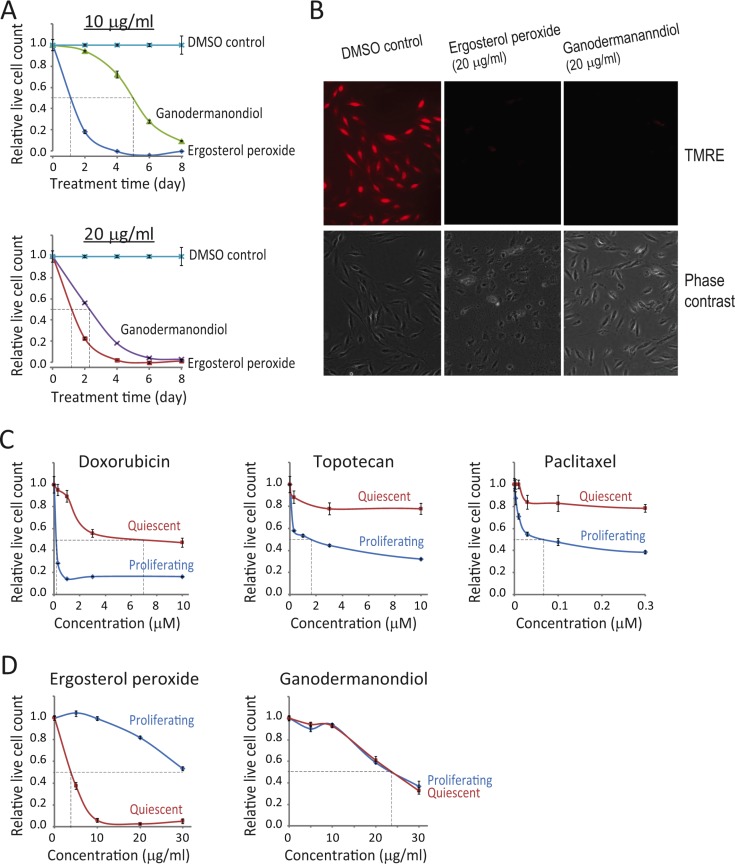
Figure 2. Compound cytotoxicity in a fibroblast quiescence model by inducing apoptosis.
(A) Compound cytotoxicity time course in quiescent REF/E23 cells. Serum starvation-induced quiescent REF/E23 cells were treated with ergosterol peroxide or ganodermanondiol at 10 and 20 μg/ml as indicated. The relative live cell count (y-axis) was determined as in Figure 1B at the indicated day (x-axis) during the course of treatment. Error bar indicates the standard error of the median (of four replicates). (B) Induced apoptosis. Serum starvation-induced quiescent REF/E23 cells were treated with ergosterol peroxide or ganodermanondiol at 20 μg/ml or DMSO vehicle control. Cells were assayed for mitochondrial membrane potential using TMRE staining after 1 day of treatment. Phase-contrast images were acquired from the same microscopy fields of the corresponding TMRE images. (C, D) Cytotoxicity in proliferating vs. quiescent cells. Actively cycling or serum starvation-induced quiescent REF/E23 cells were treated with doxorubicin, topotecan, and paclitaxel (C) or ergosterol peroxide and ganodermanondiol (D) at indicated concentrations for 48 hours (concentration = 0: DMSO vehicle control). The relative live cell count (y-axis) was subsequently determined as in Figure 1B. Error bar indicates the standard error of the median (of four replicates).

