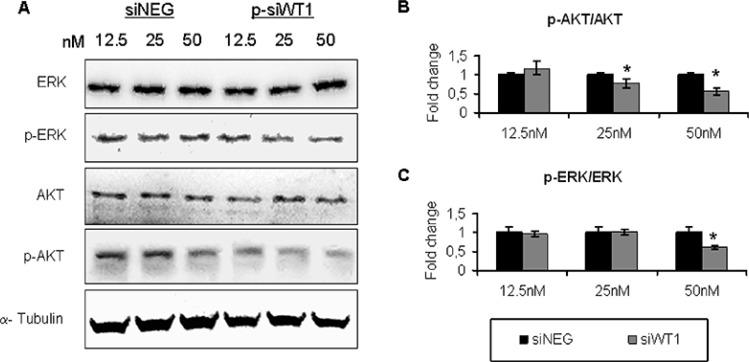
Figure 6. WT1 silencing interfered with phosphorilation of AKT and ERK in MG-63 cell lines.
(A) Representative immunoblotting of pAKT, AKT, pERK, and ERK in MG-63 cells treated with 12.5 nM, 25 nM and 50 nM siNEG or p-siWT1. (B) The p-AKT/AKT ratio was reported as fold change in siWT1 groups compared to each siNEG ones (n = 3; *P < 0.05 compared to respective siNEG group). (C) The p-ERK/ERK ratio in siWT1 groups was reported as fold change compared to siNEG ones (n = 3; *P < 0.05 compared to respective siNEG group).

