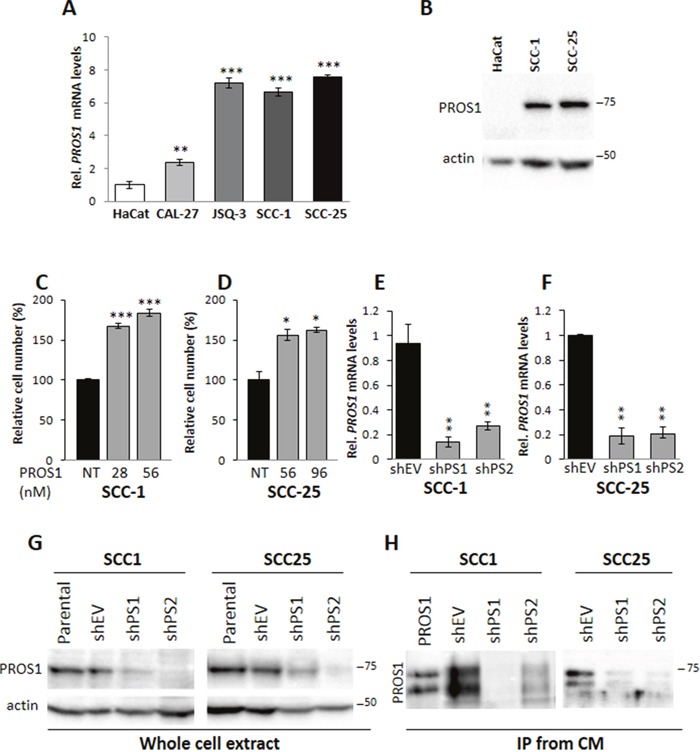
Figure 1. PROS1 is expressed in OSCC cells and stimulates cell proliferation.

A. Analysis of PROS1 mRNA levels by realtime qPCR in different OSCC cell lines. Results presented are relative to PROS1 mRNA levels in HaCat immortalized human keratinocytes. Graphs represent mean ± SEM from 3 independent experiments. ***P<0.001. B. Analysis of PROS1 protein levels in whole cell extracts from the indicated cell lines. High PROS1 levels are detected in SCC-1 and SCC-25 OSCC cell lines, but not in the immortalized human Keratinocyte cell line HaCaT. Actin serves a as loading control. One representative blot of three independent experiments is shown. C, D. Dose dependent effects of PROS1 on proliferation of SCC-1 (C) and SCC-25 (D) cells. hPROS1 was added to the cells at the indicated concentrations (nmol/L) 48 hours before performing proliferation assays. Proliferation is plotted as a percentage of growth relative to vehicle-treated cells. The means ± SEM of a representative experiment out of four are shown. *P<0.05, ***P<0.001. E, F. Effective knockdown of PROS1 in SCC1 (E) and SCC-25 (F) OSCC lines by two different sh targeting sequences. RT-qPCR detection of PROS1 mRNA in control (EV)-treated and PROS1-knockdown populations using two different PROS1- targeting sequences (shPS1, shPS2). qPCR data are normalized to β-actin. Graphs represent mean ± SEM from 3 experiments. **P<0.01. G. Analysis of PROS1 protein levels in whole cell extracts by western blot analysis in SCC-1 (left) and SCC-25 (right) parental, control-treated (shEV) and stable PROS1- knockdown cell lines (shPS1, shPS2). Actin serves as a loading control. Results are representative of five independent experiments. H. Analysis of secreted PROS1 levels from conditioned medium (CM) by immunoprecipitation (IP) followed by western blot with anti-PROS1 antibody from control and sh-PS stable cell lines. Purified PROS1 served as a positive control. Purified and secreted PROS1 appear as a doublet, following proteolytic cleavage by serum enzymes. Results are representative of five independent experiments.
