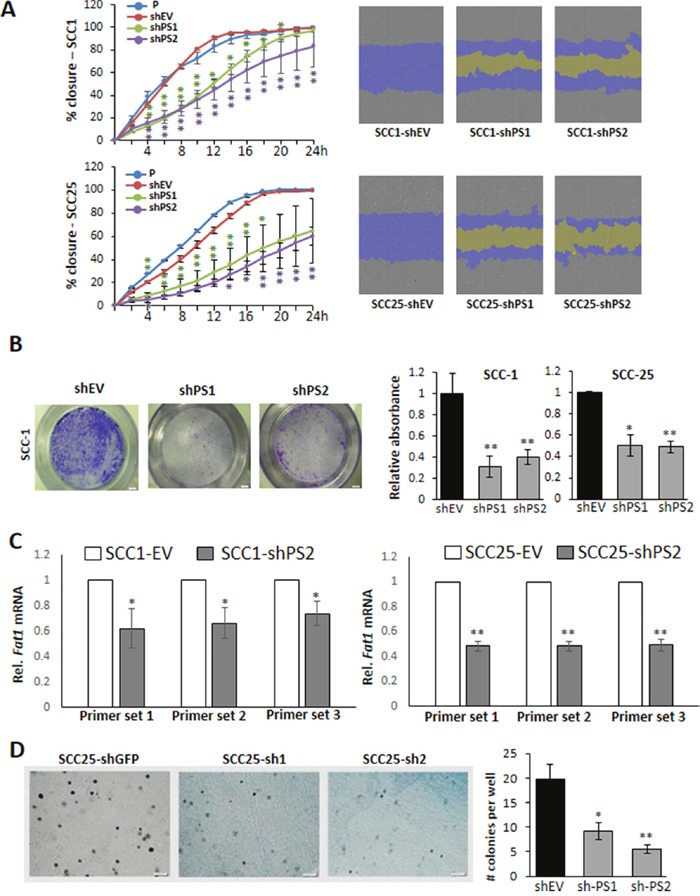
Figure 3. PROS1 inhibition attenuates migration and growth in soft agar.

A. Quantification of the scratch closure area as percent of the original scratch area is plotted against time (left) and the actual images of the scratch area (right) as automatically performed by the IncuCyte cell ZOOM live cell analysis system. Representative scratches are shown on the right: covered wound areas are depicted in purple, uncovered areas in yellow. Inhibition of PROS1 attenuated migration in both SCC-1 (top) and SCC-25 (bottom) cells. Results are representative of five experiments, each in triplicate or sextuplicates using different batches of cells. P values are indicated by asterisks for each time point on the graphs. * P<0.05; **P<0.01. B. PROS1 knockdown inhibits cell migration in a transwell migration assay. Cells were allowed to migrate for 4 hours, stained and documented. Representative transwells are shown for SCC-1 lines after staining the cells that have migrated with crystal violet (left). Quantification of migratory cells was performed using crystal violet (right). Data represent means ± SEM from at least three independent experiments using different batches of cells (N≥15 in 4 independent experiments). *P<0.05, **P<0.05. C. FAT1 expression is reduced in OSCC lines following PROS1-knockdown. Relative FAT1 mRNA levels were normalized to GAPDH and evaluated using primers targeting three different locations spanning the large transcript to assess expression of the full transcript [23]. Representative data from one of three independent experiments are shown for each cell line. *P<0.05; **P<0.01. D. Anchorage-independent growth is attenuated following PROS1-knockdown. Soft agar growth assay showing colony formation 14 days after seeding. Representative colony growth is shown. Quantification of anchorage-independent colony formation in control (shGFP) and following PROS1 knockdown using two different PROS1 targeting vectors is shown. Data represent means ± SEM from at least three independent experiments using different batches of cells (N=3 in 3 independent experiments). *P<0.05, **P<0.05.
