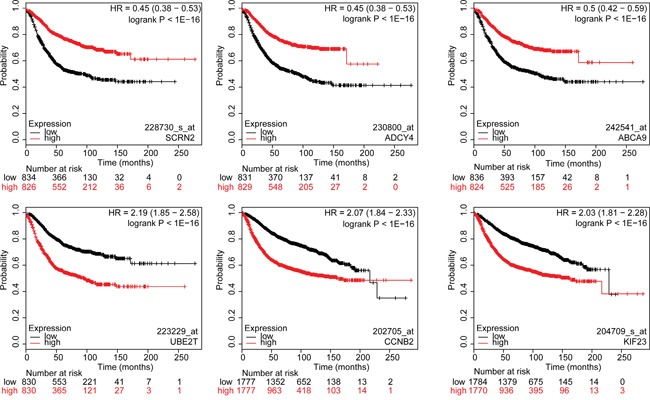
Figure 3. Kaplan-Meier survival curves for breast cancer patients according to tumor expression of genes with highest and lowest hazard ratios.

The breast cancer patient cohort was divided into two equal groups based on median expression for each gene and compared by a Kaplan-Meier survival analysis. The estimate of the hazard ratio (HR) and log-rank p-value of the curve comparison between the groups is shown. Top three genes with the lowest HR values (top row): SCRN2, ADCY4 and ABCA9. Top three genes with the highest HR values (bottom row): UBE2T, CCNB2 and KIF23. Low and high risks indicated in black and red, respectively.
